Review
. 2016 Aug 15:4:51.
doi: 10.1186/s40560-016-0176-x. eCollection 2016.

Make it SIMPLE: enhanced shock management by focused cardiac ultrasound

Affiliations
Review

Make it SIMPLE: enhanced shock management by focused cardiac ultrasound

Ka Leung Mok. J Intensive Care. .

Abstract

Background: Shock is a spectrum of circulatory failure that, if not properly managed, would lead to high mortality. Special diagnostic and treatment strategies are essential to save lives. However, clinical and laboratory findings are always non-specific, resulting in clinical dilemmas.

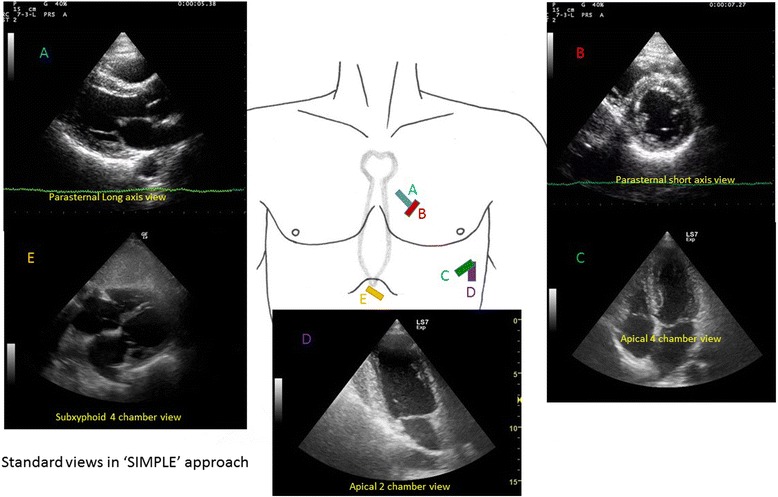
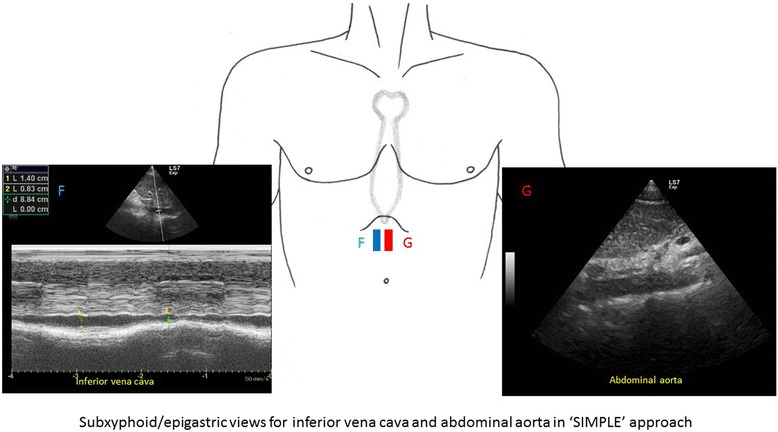
Main content: Focused cardiac ultrasound (FoCUS) has emerged as one of the power tools for clinicians to answer simple clinical questions and guide subsequent management in hypotensive patients. This article will review the development and utility of FoCUS in different types of shock. The sonographic features and ultrasound enhanced management of hypotensive patients by a de novo "SIMPLE" approach will be described. Current evidence on FoCUS will also be reviewed.

Conclusion: Focused cardiac ultrasound provides timely and valuable information for the evaluation of shock. It helps to improve the diagnostic accuracy, narrow the possible differential diagnoses, and guide specific management. SIMPLE is an easy-to-remember mnemonic for non-cardiologists or novice clinical sonographers to apply FoCUS and interpret the specific sonographic findings when evaluating patients in shock.

Keywords: Critical care; Echocardiography; Emergency department; Sepsis; Shock; Ultrasound.


Figures

Fig. 1
Fig. 1
Five standard views used in focus echocardiography. They include parasternal long axis (a), parasternal short axis (b), apical four-chamber (c), apical two-chamber (d), and subxyphoid four-chamber views (e)
Fig. 2
Fig. 2
Subxyphoid/epigastric views for inferior vena cava (F) and abdominal aorta assessment (G)
Fig. 3
Fig. 3
The normal LVEDA measurement. The LVEDA is measured at the level of mid-papillary level of left parasternal short axis view in a normal human being. (LVEDA left ventricular end diastolic area, LV left ventricle)
Fig. 4
Fig. 4
Acute cor pulmonale due to massive pulmonary embolism. A parasternal short axis view shows a dilated RV and D-shaped LV on parasternal view in a patient with massive pulmonary embolism. The flattened IVS is highlighted by red arrows. (RV right ventricle; LV left ventricle)
Fig. 5
Fig. 5
Normal M-mode tracing of the inferior vena cava throughout the respiratory cycle. Variation of the inferior vena cava diameter throughout the respiratory cycle is shown
Fig. 6
Fig. 6
Aortic dissection. Intimal flap (red arrow) is seen in the dilated proximal ascending aorta (5.9 cm) in a confirmed case of type A aortic dissection. (LV left ventricle)
Fig. 7
Fig. 7
Pulmonary embolism. In this apical four-chamber view, echogenic blood clots (red arrows) in the right atrium protruding into the right ventricle through the tricuspid valve during diastole are seen in a patient with confirmed massive pulmonary embolism(RA right atrium, RV right ventricle, LA left atrium, LV left ventricle)
Fig. 8
Fig. 8
a, b Pericardial effusion (PcE). A large amount of pericardial effusion (PcE) is seen in both parasternal long axis and short axis view. The maximum size of the pericardial effusion measures 2.83 cm. Note the relationship between the pericardial effusion and the descending aorta (DA). (RV right ventricle, LV left ventricle, PW posterior wall of LV, PcE pericardial effusion, LA left atrium, RVOT right ventricular outflow tract, DA descending aorta, AVG atrioventricular groove)
Fig. 9
Fig. 9
Pleural effusion (PLE). The parasternal long axis view shows anechoic pleural effusion (PLE) accumulated posterior to the descending aorta (DA). Pericardium (PC) is represented by the pink strip here. Also pleural effusion, if large amount, can extend beyond the atrioventricular groove in contrast with pericardial effusion which terminates at the atrioventricular groove. (AV aortic valve, LVOT left ventricular outflow tract, PC pericardium, PLE pleural effusion, RA right atrium, RV right ventricle, DA descending aorta, AVG atrioventricular groove)
Fig. 10
Fig. 10
a, b Aortic dissection of abdominal aorta. In this patient with extensive Stanford type A aortic dissection, intimal flap (red arrows) is seen inside the lumen of abdominal aorta as an echogenic film separating the false lumen (F) and true lumen (T). (F false lumen, T true lumen, IVC inferior vena cava)
Fig. 11
Fig. 11
a, b Severe hypovolemic shock. Kissing walls of left ventricle on parasternal short axis view is shown. The left ventricle is obliterated during systole. This patient suffered from severe hypovolemia due to gastrointestinal bleeding. (RV right ventricle, LV left ventricle)
Fig. 12
Fig. 12
Collapsed IVC. IVC thickness is markedly reduced (thickness = 6.7 mm) with complete collapse on inspiration in a patient with hypovolemic shock
Fig. 13
Fig. 13
Poor LV systolic function. This parasternal long axis view shows a dilated LV with poor fractional shortening (FS = 18.6 %) in a patient with dilated cardiomyopathy and hypotension (FS = fractional shortening)
Fig. 14
Fig. 14
a, b Cardiac tamponade. These two images show collapsed RA and RV (red arrows) on apical four-chamber view and parasternal long axis view in a patient with cardiac tamponade (PcE = pericardial effusion)
Fig. 15
Fig. 15
Distended IVC. This is the M-mode tracing of IVC in a patient with massive PE. The IVC is plethoric of a diameter >2.1 cm with only minimal respiratory variation (IVC = inferior vena cava)
Fig. 16
Fig. 16
Hemopericardium and cardiac tamponade. This subxyphoid four-chamber view shows echogenic clots and hemopericardium in a patient with cardiac tamponade due to aortic dissection (PcE pericardial effusion; thickness = 28.3 mm)

References

    1. Vincent JL, De Backer D. Circulatory shock. N Engl J Med. 2013;369:1726–34. doi: 10.1056/NEJMra1208943. - DOI - PubMed
    1. Jones AE, Kline JE: S. In: Rosen’s emergency medicine: concepts and clinical practice. Volume 1. 8. Marx JA, Hockberger RS, Walls RM, editors. Philadelphia: Saunders; 2014. pp. 67–71.
    1. Singer M, Deutschman CS, Seymour C, et al. The Third International Consensus definitions for sepsis and septic shock (sepsis-3) JAMA. 2016;315(8):801–810. doi: 10.1001/jama.2016.0287. - DOI - PMC - PubMed
    1. Jones AE, Aborn LS, Kline JA. Severity of emergency department hypotension predicts adverse hospital outcome. Shock. 2004;22(5):410–4. doi: 10.1097/01.shk.0000142186.95718.82. - DOI - PubMed
    1. Holler JG, Bech CN, Henriksen DP, Mikkelsen S, Pedersen C, Lassen AT. Nontraumatic hypotension and shock in the emergency department and the prehospital setting, prevalence, etiology, and mortality: a systematic review. Calvert J, ed. PLoS One. 2015;10(3):e0119331. doi: 10.1371/journal.pone.0119331. - DOI - PMC - PubMed

LinkOut - more resources