. 2016 Aug 16:5:e16695.
doi: 10.7554/eLife.16695.

A Cryptochrome 2 mutation yields advanced sleep phase in humans

Affiliations

A Cryptochrome 2 mutation yields advanced sleep phase in humans

Arisa Hirano et al. Elife. .

Abstract

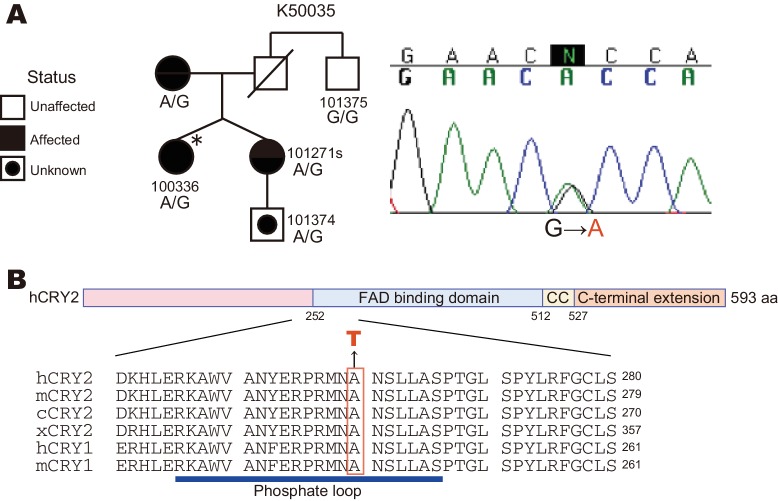
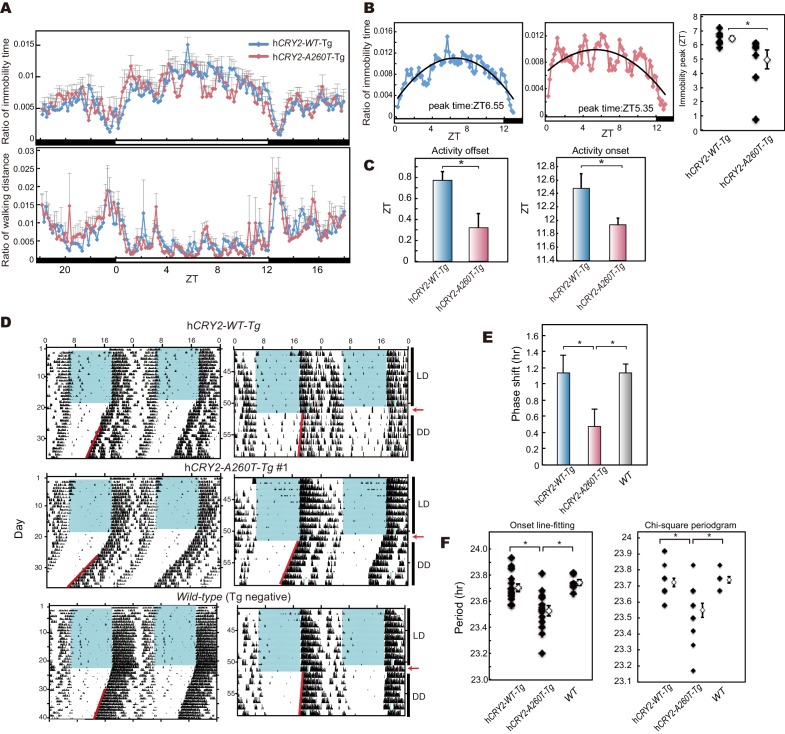
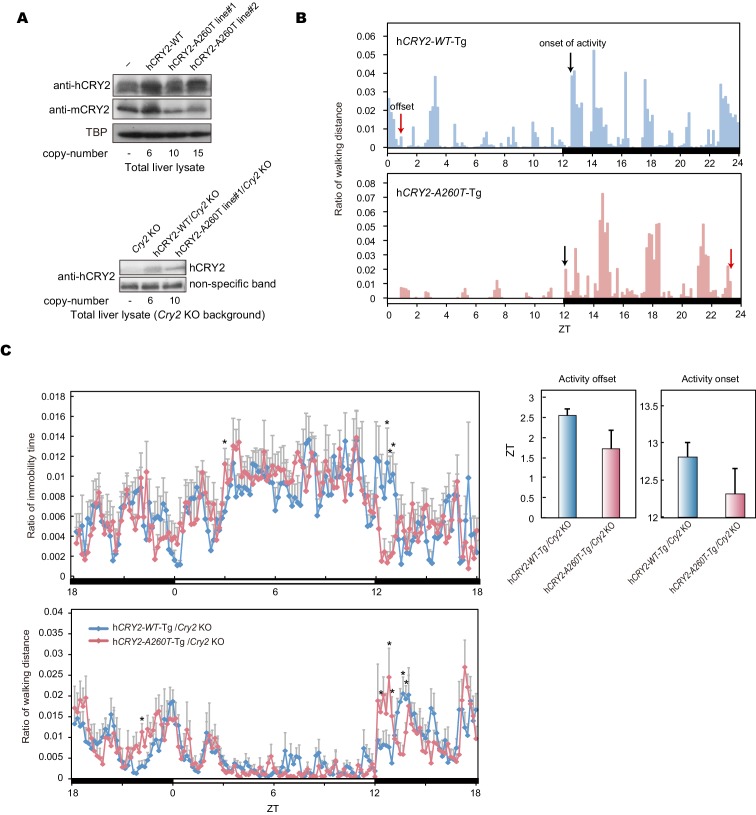
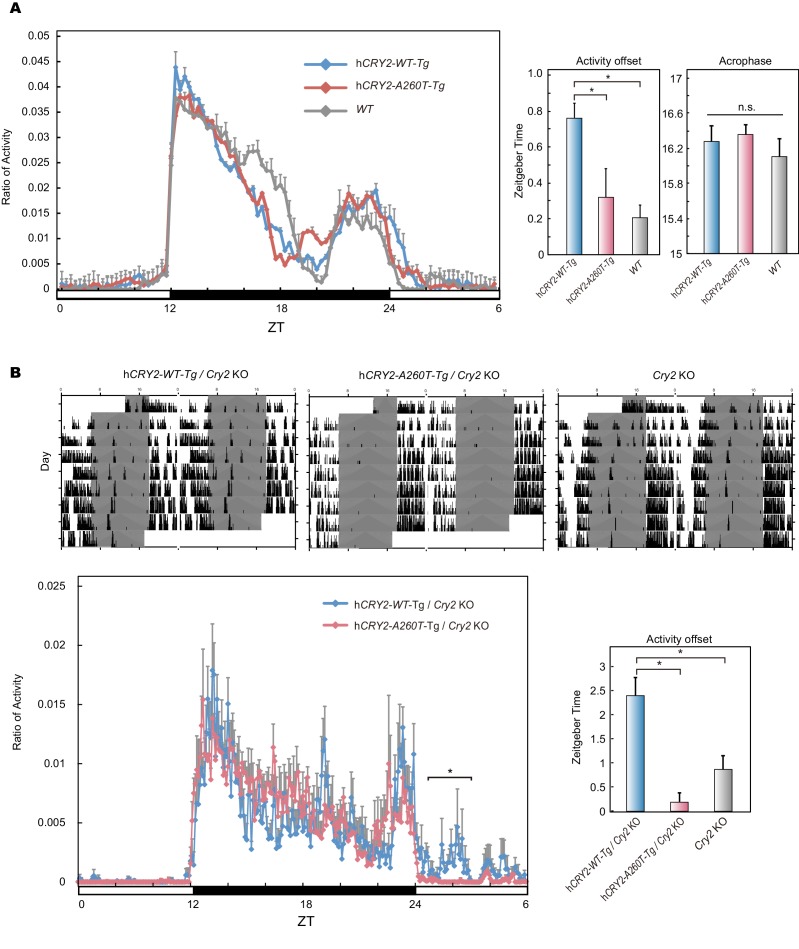
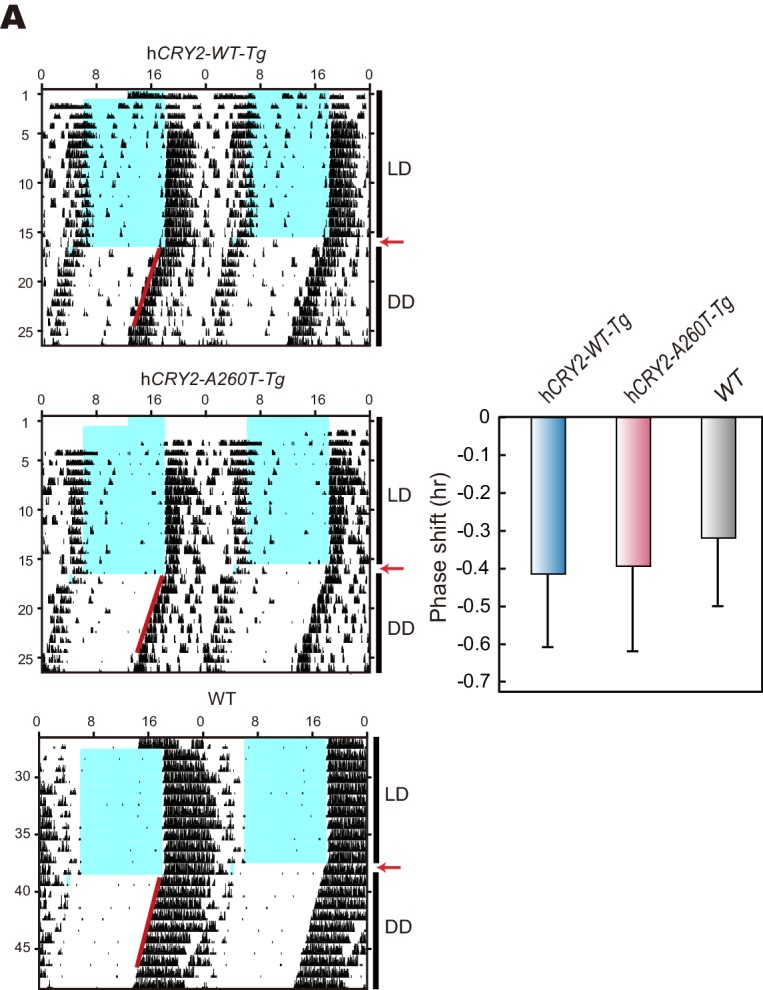
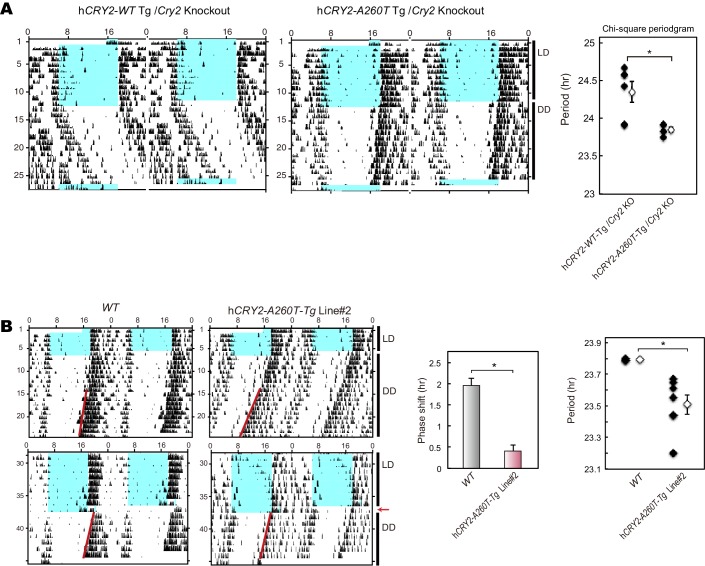
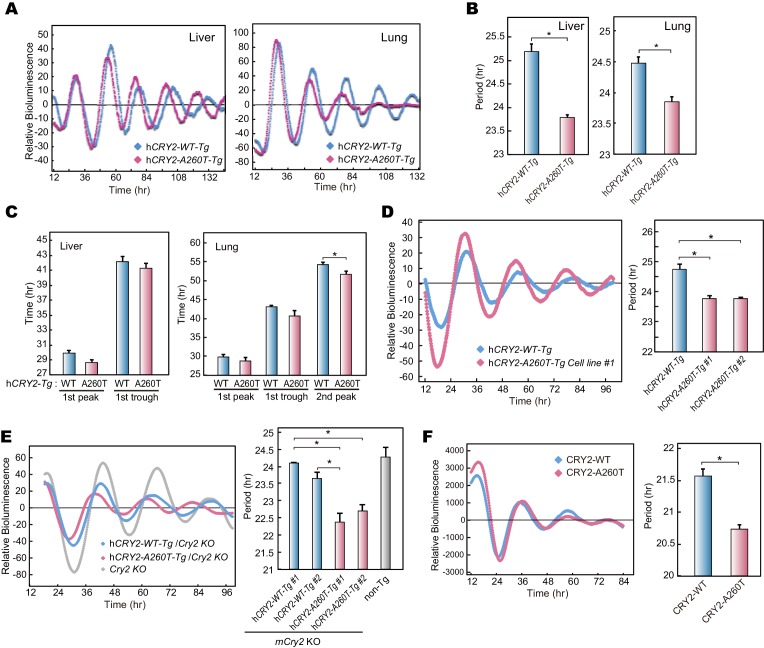
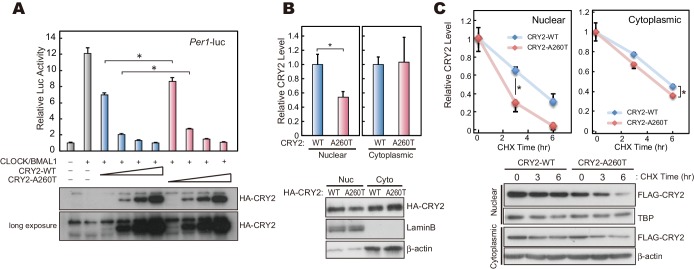
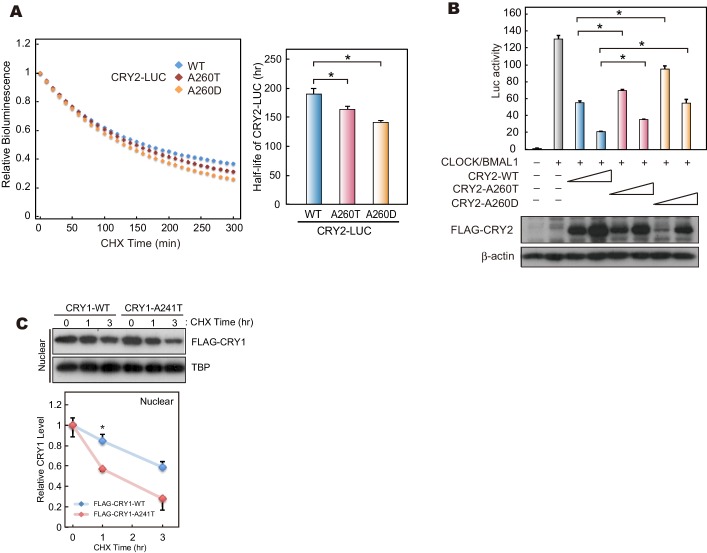
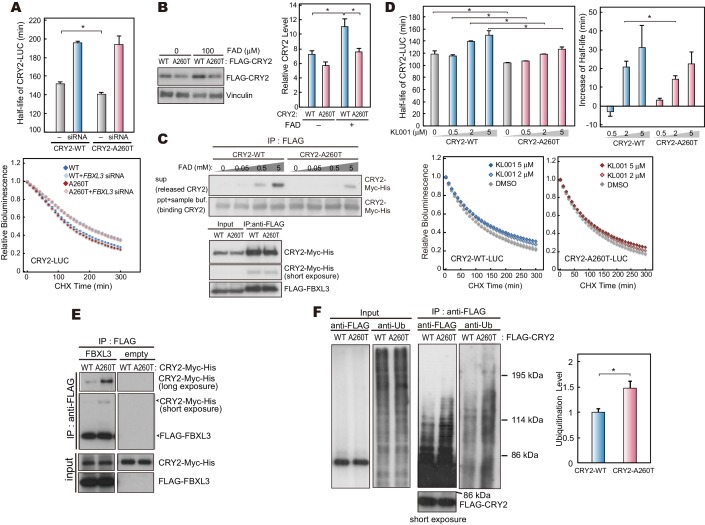
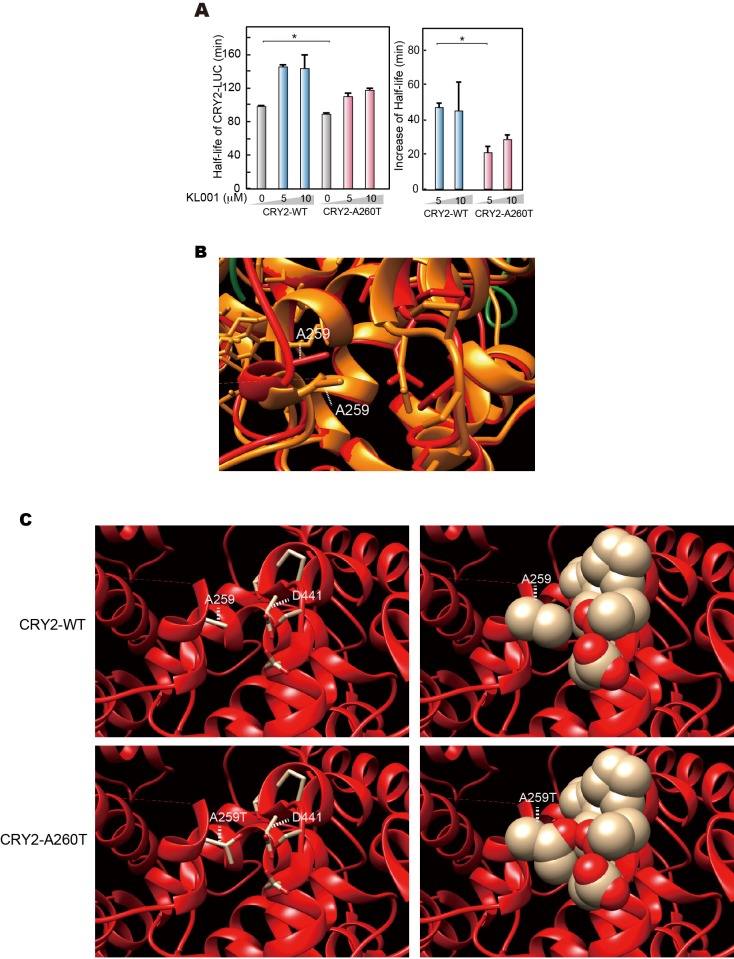
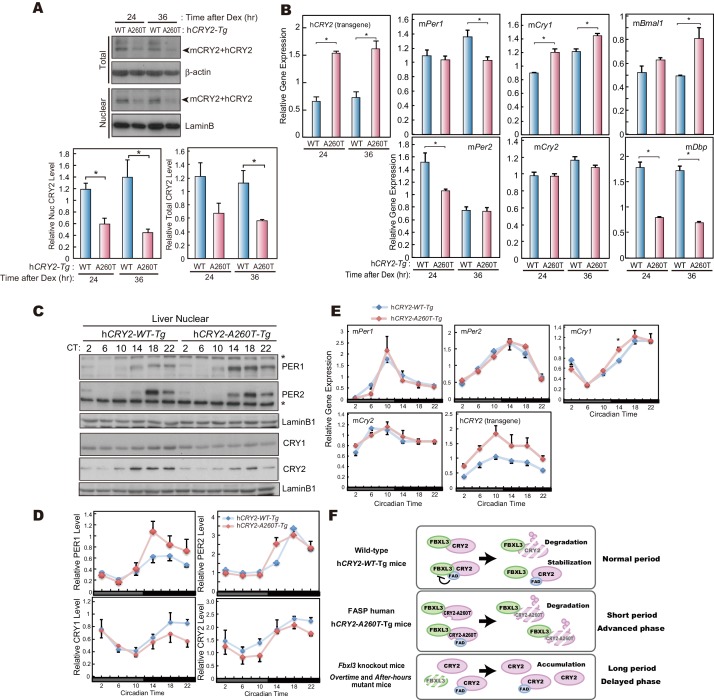
Familial Advanced Sleep Phase (FASP) is a heritable human sleep phenotype characterized by very early sleep and wake times. We identified a missense mutation in the human Cryptochrome 2 (CRY2) gene that co-segregates with FASP in one family. The mutation leads to replacement of an alanine residue at position 260 with a threonine (A260T). In mice, the CRY2 mutation causes a shortened circadian period and reduced phase-shift to early-night light pulse associated with phase-advanced behavioral rhythms in the light-dark cycle. The A260T mutation is located in the phosphate loop of the flavin adenine dinucleotide (FAD) binding domain of CRY2. The mutation alters the conformation of CRY2, increasing its accessibility and affinity for FBXL3 (an E3 ubiquitin ligase), thus promoting its degradation. These results demonstrate that CRY2 stability controlled by FBXL3 plays a key role in the regulation of human sleep wake behavior.

Keywords: FBXL3; Familial Advanced Sleep Phase; circadian clock; circadian rhythm; cryptochrome2; human; human biology; medicine; mouse; neuroscience.


Conflict of interest statement

LJP: Reviewing editor, eLife.

The other authors declare that no competing interests exist.

Figures

Figure 1.
Figure 1.. A CRY2 mutation in FASP kindred 50035.
(A) Pedigree of the family (kindred 50035) segregating the CRY2 mutation (A260T). Circles and squares represent women and men, respectively. An asterisk marks the proband. A missense mutation from G to A causes an amino acid conversion from Alanine to Threonine at position 260. (B) Amino acid alignment around the mutation site. The A260T mutation is located in the N-terminal portion of the FAD binding domain in CRY2. This residue is highly conserved among vertebrate species. CC denotes a Coiled-Coil sequence. DOI: http://dx.doi.org/10.7554/eLife.16695.003
Figure 2.
Figure 2.. hCRY2-A260T mice have advanced phase of sleep-wake behavior in a light-dark cycle and a shortened circadian period in constant darkness.
(A) Mouse movement was tracked by an infrared video camera in LD. The ratio of immobilization time to total daily immobilization time (upper panel) and the ratio of walking distance to total daily distance (bottom panel) were plotted every 10 min. Data are shown as means with SEM (n = 8 for hCRY2-WT and hCRY2-A260T). (B) Peak time of immobility was measured by fitting a quadratic function to data from ZT0 to 13. Representative examples of curve fitting for hCRY2-WT and hCRY2-A260T are shown here. Data are shown as means with SEM (n = 8 for hCRY2-WT and hCRY2-A260T, *p<0.05 by Student’s t-test). (C) Onset and offset of locomotor activity. Data are shown as means with SEM (n = 8 for hCRY2-WT and hCRY2-A260T). (D) Actograms of wheel-running activity for hCRY2-WT, hCRY2-A260T, and littermate transgene-negative mice. The blue shadows indicate periods when the lights were on. Red lines were fitted to activity onset using ClockLab analysis software. (E) Phase-shifts in response to a 30-min light exposure at ZT14 indicated by red arrows in (D). *p<0.05 by Tukey’s test (n = 7 for hCRY2-WT, n = 11 for hCRY2-A260T, n = 10 for WT). (F) The distribution of period measurements for BAC transgenic mice and transgene negative controls. Period was determined by line fitting of activity onset and chi-square periodogram from day 7 to day 19 in DD. *p<0.05 (n = 15 for hCRY2-WT, n = 14 for hCRY2-A260T and n = 7 for WT) DOI: http://dx.doi.org/10.7554/eLife.16695.005
Figure 2—figure supplement 1.
Figure 2—figure supplement 1.. Locomoter activity of h CRY2 BAC Tg mice.
(A) CRY2 expression in total liver lysate at ZT18. CRY2 protein was detected by human CRY2 antibody (Santa Cruz) and mouse CRY2 antibody (Hirano et al., 2013). Copy number was determined by real-time PCR using common sequences in mouse and human Cry2 genes. (B) Representative profiles of locomotor activity measured by video recording. Activity onset (black) and offset (red) are indicated by arrows in the figures. The time of onset and offset for all animals of respective genotypes are averaged and plotted in Figure 2C. (C) Locomotor activity and resting behavior of transgenic mice on a mCry2 knockout background. Mouse movement was tracked by an infrared video camera in LD. The ratio of immobilization time to total daily immobilization time (upper panel) and the ratio of walking distance to total daily distance (bottom panel) were plotted every 10 min. Data are shown as means with SEM (n = 6 for hCRY2-WT/Cry2 KO, n = 6 for hCRY2-A260T/Cry2 KO). The average of activity offset and onset in LD 12:12 are shown (n = 6 for hCRY2-WT/Cry2 KO, n = 6 for hCRY2-A260T/Cry2 KO). DOI: http://dx.doi.org/10.7554/eLife.16695.006
Figure 2—figure supplement 2.
Figure 2—figure supplement 2.. Wheel-running activity of hCRY2 BAC Tg mice.
(A) Activity profiles of transgenic mice in LD 12:12. Ratio of wheel-running counts to total daily counts are plotted every 20 min (n = 18 for hCRY2-WT, n = 14 for hCRY2-A260T). The average of activity offset in LD 12:12 are shown in the right graph. *p<0.05 by Tukey’s test (n = 19 for hCRY2-WT, n = 19 for hCRY2-A260T and n = 7 for WT). (B) Actograms and activity profiles of transgenic mice on a mCry2 knockout background in LD 12:12. Ratio of wheel-running counts to total daily counts are plotted every 5 min (n = 5 for hCRY2-WT, n = 5 for hCRY2-A260T). The average of activity offset in LD 12:12 are shown in the right graph. *p<0.05 by Tukey’s test (n = 5 for hCRY2-WT/mCry2 KO, n = 5 for hCRY2-A260T/mCry2 KO and n = 6 for mCry2 KO). DOI: http://dx.doi.org/10.7554/eLife.16695.007
Figure 2—figure supplement 3.
Figure 2—figure supplement 3.. Light phase-shift of hCRY2 BAC Tg mice at ZT22.
(A) Phase-shift in response to 30-min light exposure at ZT22. Mice were exposed to a 30-min light pulse at ZT22 (indicated by red arrows) and released into DD after the light pulse. The blue shadows indicate periods when the lights were on. Red lines were fitted to activity onset using ClockLab analysis software. Phase-shift was determined by line-fitting to activity onset (n = 6 for hCRY2-WT, n = 7 for hCRY2-A260T and WT). DOI: http://dx.doi.org/10.7554/eLife.16695.008
Figure 2—figure supplement 4.
Figure 2—figure supplement 4.. Wheel-running activity of hCRY2Cry2 BAC Tg mice on a m KO background and another BAC Tg mice line.
(A) Circadian period of the transgenic mice on a mCry2 knockout background. Period was determined by chi-square periodgram from day 7 to day 14 in DD. *p<0.05 by Welch’s test (n = 6 for hCRY2-WT/mCry2KO and n = 5 for hCRY2-A260T/mCry2KO). (B) Circadian period and phase-shift of hCRY2-A260T mice line#2. Representative actograms of wheel-running activity of hCRY2-A260T line#2 and littermate controls (WT) are shown. The blue shadows indicate periods when the lights were on. Red lines were fitted to activity onset using ClockLab analysis software. Phase-shifts shown here are by 30-min light exposure at ZT14 (left panel, n = 7 for hCRY2-A260T line#2, n = 3 for WT). Period was determined by line fitting of activity onset from day 7 to day 19 in DD. *p<0.05 by Student’s t-test (right panel, n = 7 for hCRY2-A260T line#2, n = 3 for WT). DOI: http://dx.doi.org/10.7554/eLife.16695.009
Figure 3.
Figure 3.. Bioluminescence rhythms in tissue cultures from hCRY2-A260T mice and CRY2-A260T stable cell lines.
(A) Representative rhythms of PER2::LUC bioluminescence in the liver and lung. Data were detrended by subtracting the 24 hr average of bioluminescence. (B) Period measurements of the bioluminescence rhythms in liver and lung tissues. Data are shown as means ± SEM (n = 4 for liver and hCRY2-WT lung, n = 3 for hCRY2-A260T lung, *p<0.05 by Student’s t-test). (C) Peak and trough time of PER2::LUC bioluminescence rhythms of mouse liver and lung tissues. Data are shown as means ± SEM (n = 4 for liver). Data are shown as means ± SD (n = 2 to 4 for lung, *p<0.05 by Student’s t-test). (D) Representative rhythms of PER2::LUC bioluminescence in MEFs from hCRY2 transgenic mice. Data were detrended by subtracting the 24 hr average of bioluminescence. Period lengths of the bioluminescence rhythms are shown as means ± SEM (n = 4, *p<0.05 by Tukey’s test). (E) Representative examples of bioluminescence rhythms of mBmal1-luc in MEFs from transgenic mice on a mCry2 knockout background. Cells were transfected with mBmal1-luc vector 24 hr before the recording. Data were detrended by subtracting the 24 hr average of bioluminescence. Period lengths of the bioluminescence rhythms in the stable cell lines are shown as means ± SEM (n = 4, *p<0.05 by Games-Howell test). (F) Representative examples of bioluminescence rhythms of Bmal1-luc in NIH3T3 cells stably expressing FLAG-CRY2-WT or FLAG-CRY2-A260T. Data were detrended by subtracting the 24 hr average of bioluminescence. Period lengths of the bioluminescence rhythms in the stable cell lines are shown as means ± SEM (n = 3, *p<0.05 by Student’s t-test). DOI: http://dx.doi.org/10.7554/eLife.16695.010
Figure 4.
Figure 4.. CRY2-A260T is less stable, particularly in nuclei.
(A) Luciferase activity driven by mouse Per1 E-box in HEK293 cells. 2, 5, 10 and 20 ng of hCRY2 expression vector (WT or A260T) was transfected into cells cultured in a 24-well plate. Luciferase activity was normalized to Renilla luciferase activity. Data are shown as means with SEM (n = 4, *p<0.05 by Student’s t-test). (B) Protein levels of CRY2-WT and CRY2-A260T in the nuclear and cytosolic fractions of HEK293 cells. Data are shown as means with SEM (n = 3, *p<0.05 by Student’s t-test). (C) Degradation assay of CRY2 protein in HEK293 cells. Forty-eight hours after transfection, cells were treated with 100 μg/ml CHX and fractionated into the nuclear and cytosolic fractions. CRY2 protein levels at the starting point (t = 0 hr) were normalized to 1. Data are shown as means with SEM (n = 3*, p<0.05 by Student’s t-test). DOI: http://dx.doi.org/10.7554/eLife.16695.011
Figure 4—figure supplement 1.
Figure 4—figure supplement 1.. The effects of mutations at A260 on protein stability, repressor activity.
(A) Twenty-four hours after transfection, the culture media was changed to recording media containing 100 µg/ml CHX, and bioluminescence of CRY2-LUC (WT, A260T or A260D) was recorded continuously. Bioluminescence normalized to the start point was fitted to an exponential curve to determine half-life of CRY2-LUC (right panel). Data are shown as means ± SEM (n = 4, *p<0.05 by Tukey’s test). Left panel shows representative bioluminescence decay of CRY2-LUC. (B) Luciferase activity driven by mouse Per1 E-box. 10 or 25 ng of CRY2 construct was transfected to HEK293 cells cultured in 24-well plate. Luciferase activity was normalized to Renilla luciferase activity. Data are shown as means ± SEM (n = 3, *p<0.05 by Tukey’s test). (C) Degradation assay of CRY1 protein in HEK293 cells. Sixty hours after transfection, cells were treated with 100 μg/ml CHX and fractionated into the nuclear and cytosolic fractions. CRY1 protein levels at the starting point (t = 0 hr) were normalized to 1. Data are shown as means with SEM (n = 3*, p<0.05 by Student’s t-test). DOI: http://dx.doi.org/10.7554/eLife.16695.012
Figure 5.
Figure 5.. CRY2-A260T binds more strongly to FBXL3 leading to faster degradation of mutant CRY2.
(A) Effect of human FBXL3 knockdown on CRY2 protein stability in HEK293 cells. Forty-eight hours after transfection, the culture medium was changed to the recording medium containing 100 μg/ml CHX, and bioluminescence of CRY2-LUC was recorded continuously. Bioluminescence normalized to the value at time 0 was fitted to an exponential curve to determine half-life of CRY2-LUC. Data are shown as means with SEM (n = 4, *p<0.05 by Welch’s t-test). (B) Effect of FAD on CRY2 protein levels. Forty-two hours after transfection, HEK293 cells were treated with 100 μM FAD for 6 hr. Data are shown as means with SEM (n = 3, *p<0.05 by Student’s t-test). (C) FAD and FBXL3 competition assay. CRY2-FBXL3 complex expressed in HEK293 cells was purified using FLAG antibody. FAD was added to CRY2-FBXL3 complex and incubated at 4°C for 2 hr in vitro. (D) CRY2 protein stability in the cells treated with KL001. Twenty-four hours after transfection, the culture medium was changed to the recording medium containing 100 μg/ml CHX and KL001. Recording of bioluminescence and calculation of half-life was performed as described above. *p<0.05 by Student’s t-test (n = 3). (E) Interaction of CRY2 with FBXL3 in HEK293 cells treated with MG132 for 6 hr prior to harvesting. (F) Ubiquitylation of CRY2. HEK293 cells expressing FLAG-CRY2 were treated with MG132 for 6 hr before harvesting. FLAG-CRY2 was then purified and blotted with anti-Ubiquitin antibody. Quantitative data are shown as means with SEM (n = 3, *p<0.05 by Student’s t-test). DOI: http://dx.doi.org/10.7554/eLife.16695.013
Figure 5—figure supplement 1.
Figure 5—figure supplement 1.. Structural modeling of A260T CRY2.
(A) CRY2 protein stability in the cells treated with KL001. Twenty-four hours after transfection, the culture medium was changed to the recording medium containing 100 μg/ml CHX and KL001 at the indicated concentration. *p<0.05 by Student’s t-test (n = 3). (B) Structure of mouse CRY2 bound to FAD (PDB code 4I6G) (orange) or FBXL3 (4I6J) (red). Green represents FBXL3. Short dashed lines indicate the side chain of A259 (A260 of human CRY2). CRY2 bound to FBXL3 is in a more open conformation compared to the FAD-bound CRY2. (C) Structure of mouse CRY2-WT (top) or mouse CRY2-A259T (corresponded to human CRY2-A260T, bottom) bound to FBXL3. The Ala to Thr mutation increases the molecular density and likely changes the conformation of CRY2 from the FAD-bound form to the FBXL3-bound form, in which main chain around A259 moved to left side in this image. DOI: http://dx.doi.org/10.7554/eLife.16695.014
Figure 6.
Figure 6.. CRY2-A260T expression is down-regulated in hCRY2-A260T mice.
(A) CRY2 protein levels in synchronized MEFs. Cells were treated with 100 nM Dex for 2 hr to synchronize the cellular rhythms. Media was change and MEFs were cultured for 24 or 36 hr before harvesting. Quantified band intensities of CRY2 (mouse CRY2 and human CRY2) are shown as means ± SEM (n = 3, *p<0.05 by Student’s t-test). (B) mRNA levels of clock genes in synchronized MEFs. Cellular rhythms of MEFs were synchronized with 100 nM Dex for 2 hr. mRNA levels were quantified by real-time PCR. Data are shown as means ± SEM (n = 3, *p<0.05 by Student’s t-test). (C) Temporal expression profiles of PER1, PER2, CRY1 and CRY2 in mouse liver. Mice were sacrificed every 4 hr on the second day in DD. Asterisks mark non-specific bands. (D) Quantification of protein levels in (C). Data are shown as means ± SEM (n = 3). (E) mRNA levels of indicated clock genes in mouse liver. Mice were sacrificed every 4 hr on the second day in DD. mRNA levels of indicated genes were quantified by real-time PCR using gene specific primers. Data are shown as means ± SEM (n = 3). (F) Model of CRY2 protein regulation. In wild-type, FAD binding to CRY2 acts to stabilize by competing with FBXL3. In hCRY2-A260T transgenic mice or FASP human subjects with CRY2 mutations, FAD does not protect CRY2 from FBXL3-mediated degradation. Destabilization of CRY2 results in shortened period, leading to advanced sleep phase. In Fbxl3 knockout mice or mutant mice (Overtimeand After-hours) (Godinho et al., 2007; Siepka et al., 2007), CRY2 is stabilized in the nucleus, thus lengthening the circadian period. DOI: http://dx.doi.org/10.7554/eLife.16695.015
Figure 6—figure supplement 1.
Figure 6—figure supplement 1.. mRNA levels of clock genes in MEF and liver of hCRY2 BAC Tg mice.
(A) mRNA levels of indicated genes in synchronized MEFs. Cellular rhythms of MEFs were synchronized with 100 nM Dex for 2 hr. mRNA levels were quantified by real-time PCR. Data are shown as means ± SEM (n = 3, *p<0.05 by Student’s t-test). (B) Expression patterns of indicated clock genes in mouse liver. Mice were sacrificed every 4 hr on the second day in DD. mRNA levels of indicated genes were quantified by real-time PCR using gene specific primers. Data are shown as means ± SEM (n = 3). DOI: http://dx.doi.org/10.7554/eLife.16695.016

References

    1. Burgess HJ, Fogg LF. Individual differences in the amount and timing of salivary melatonin secretion. PLoS One. 2008;3:e3055. doi: 10.1371/journal.pone.0003055. - DOI - PMC - PubMed
    1. Busino L, Bassermann F, Maiolica A, Lee C, Nolan PM, Godinho SI, Draetta GF, Pagano M. SCFFbxl3 controls the oscillation of the circadian clock by directing the degradation of cryptochrome proteins. Science. 2007;316:900–904. doi: 10.1126/science.1141194. - DOI - PubMed
    1. Czarna A, Berndt A, Singh HR, Grudziecki A, Ladurner AG, Timinszky G, Kramer A, Wolf E. Structures of Drosophila cryptochrome and mouse cryptochrome1 provide insight into circadian function. Cell. 2013;153:1394–1405. doi: 10.1016/j.cell.2013.05.011. - DOI - PubMed
    1. Dupuis J, Langenberg C, Prokopenko I, Saxena R, Soranzo N, Jackson AU, Wheeler E, Glazer NL, Bouatia-Naji N, Gloyn AL, Lindgren CM, Mägi R, Morris AP, Randall J, Johnson T, Elliott P, Rybin D, Thorleifsson G, Steinthorsdottir V, Henneman P, Grallert H, Dehghan A, Hottenga JJ, Franklin CS, Navarro P, Song K, Goel A, Perry JR, Egan JM, Lajunen T, Grarup N, Sparsø T, Doney A, Voight BF, Stringham HM, Li M, Kanoni S, Shrader P, Cavalcanti-Proença C, Kumari M, Qi L, Timpson NJ, Gieger C, Zabena C, Rocheleau G, Ingelsson E, An P, O'Connell J, Luan J, Elliott A, McCarroll SA, Payne F, Roccasecca RM, Pattou F, Sethupathy P, Ardlie K, Ariyurek Y, Balkau B, Barter P, Beilby JP, Ben-Shlomo Y, Benediktsson R, Bennett AJ, Bergmann S, Bochud M, Boerwinkle E, Bonnefond A, Bonnycastle LL, Borch-Johnsen K, Böttcher Y, Brunner E, Bumpstead SJ, Charpentier G, Chen YD, Chines P, Clarke R, Coin LJ, Cooper MN, Cornelis M, Crawford G, Crisponi L, Day IN, de Geus EJ, Delplanque J, Dina C, Erdos MR, Fedson AC, Fischer-Rosinsky A, Forouhi NG, Fox CS, Frants R, Franzosi MG, Galan P, Goodarzi MO, Graessler J, Groves CJ, Grundy S, Gwilliam R, Gyllensten U, Hadjadj S, Hallmans G, Hammond N, Han X, Hartikainen AL, Hassanali N, Hayward C, Heath SC, Hercberg S, Herder C, Hicks AA, Hillman DR, Hingorani AD, Hofman A, Hui J, Hung J, Isomaa B, Johnson PR, Jørgensen T, Jula A, Kaakinen M, Kaprio J, Kesaniemi YA, Kivimaki M, Knight B, Koskinen S, Kovacs P, Kyvik KO, Lathrop GM, Lawlor DA, Le Bacquer O, Lecoeur C, Li Y, Lyssenko V, Mahley R, Mangino M, Manning AK, Martínez-Larrad MT, McAteer JB, McCulloch LJ, McPherson R, Meisinger C, Melzer D, Meyre D, Mitchell BD, Morken MA, Mukherjee S, Naitza S, Narisu N, Neville MJ, Oostra BA, Orrù M, Pakyz R, Palmer CN, Paolisso G, Pattaro C, Pearson D, Peden JF, Pedersen NL, Perola M, Pfeiffer AF, Pichler I, Polasek O, Posthuma D, Potter SC, Pouta A, Province MA, Psaty BM, Rathmann W, Rayner NW, Rice K, Ripatti S, Rivadeneira F, Roden M, Rolandsson O, Sandbaek A, Sandhu M, Sanna S, Sayer AA, Scheet P, Scott LJ, Seedorf U, Sharp SJ, Shields B, Sigurethsson G, Sijbrands EJ, Silveira A, Simpson L, Singleton A, Smith NL, Sovio U, Swift A, Syddall H, Syvänen AC, Tanaka T, Thorand B, Tichet J, Tönjes A, Tuomi T, Uitterlinden AG, van Dijk KW, van Hoek M, Varma D, Visvikis-Siest S, Vitart V, Vogelzangs N, Waeber G, Wagner PJ, Walley A, Walters GB, Ward KL, Watkins H, Weedon MN, Wild SH, Willemsen G, Witteman JC, Yarnell JW, Zeggini E, Zelenika D, Zethelius B, Zhai G, Zhao JH, Zillikens MC, Borecki IB, Loos RJ, Meneton P, Magnusson PK, Nathan DM, Williams GH, Hattersley AT, Silander K, Salomaa V, Smith GD, Bornstein SR, Schwarz P, Spranger J, Karpe F, Shuldiner AR, Cooper C, Dedoussis GV, Serrano-Ríos M, Morris AD, Lind L, Palmer LJ, Hu FB, Franks PW, Ebrahim S, Marmot M, Kao WH, Pankow JS, Sampson MJ, Kuusisto J, Laakso M, Hansen T, Pedersen O, Pramstaller PP, Wichmann HE, Illig T, Rudan I, Wright AF, Stumvoll M, Campbell H, Wilson JF, Bergman RN, Buchanan TA, Collins FS, Mohlke KL, Tuomilehto J, Valle TT, Altshuler D, Rotter JI, Siscovick DS, Penninx BW, Boomsma DI, Deloukas P, Spector TD, Frayling TM, Ferrucci L, Kong A, Thorsteinsdottir U, Stefansson K, van Duijn CM, Aulchenko YS, Cao A, Scuteri A, Schlessinger D, Uda M, Ruokonen A, Jarvelin MR, Waterworth DM, Vollenweider P, Peltonen L, Mooser V, Abecasis GR, Wareham NJ, Sladek R, Froguel P, Watanabe RM, Meigs JB, Groop L, Boehnke M, McCarthy MI, Florez JC, Barroso I, DIAGRAM Consortium. GIANT Consortium. Global BPgen Consortium. Anders Hamsten on behalf of Procardis Consortium. MAGIC investigators New genetic loci implicated in fasting glucose homeostasis and their impact on type 2 diabetes risk. Nature Genetics. 2010;42:105–116. doi: 10.1038/ng.520. - DOI - PMC - PubMed
    1. Godinho SI, Maywood ES, Shaw L, Tucci V, Barnard AR, Busino L, Pagano M, Kendall R, Quwailid MM, Romero MR, O'neill J, Chesham JE, Brooker D, Lalanne Z, Hastings MH, Nolan PM. The after-hours mutant reveals a role for Fbxl3 in determining mammalian circadian period. Science. 2007;316:897–900. doi: 10.1126/science.1141138. - DOI - PubMed

Publication types

Supplementary concepts