

Allele-Independent Turnover of Human Leukocyte Antigen (HLA) Class Ia Molecules
- PMID: 27529174
- PMCID: PMC4987023
- DOI: 10.1371/journal.pone.0161011
Allele-Independent Turnover of Human Leukocyte Antigen (HLA) Class Ia Molecules
Abstract
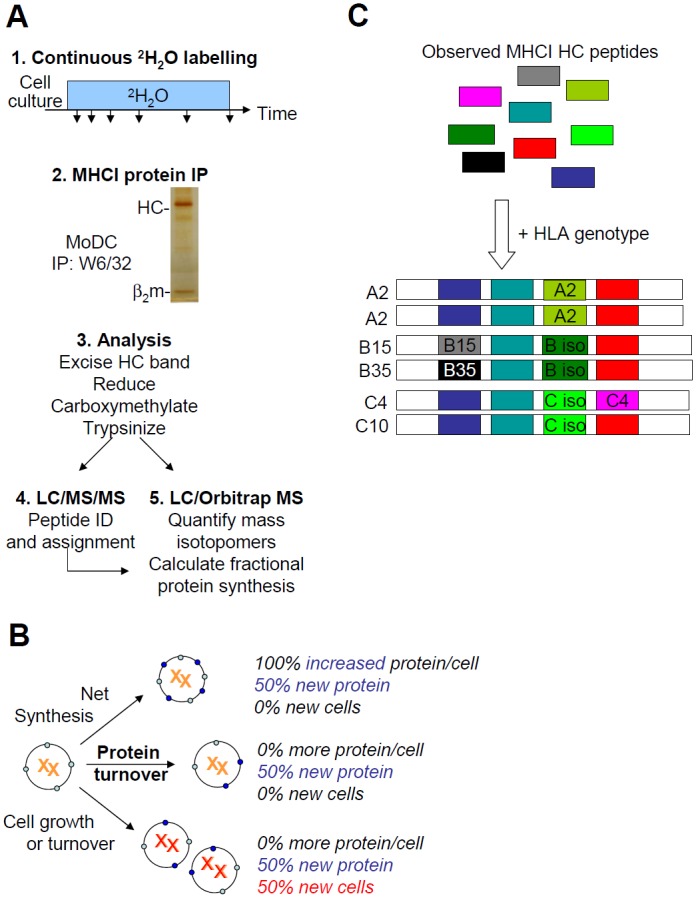
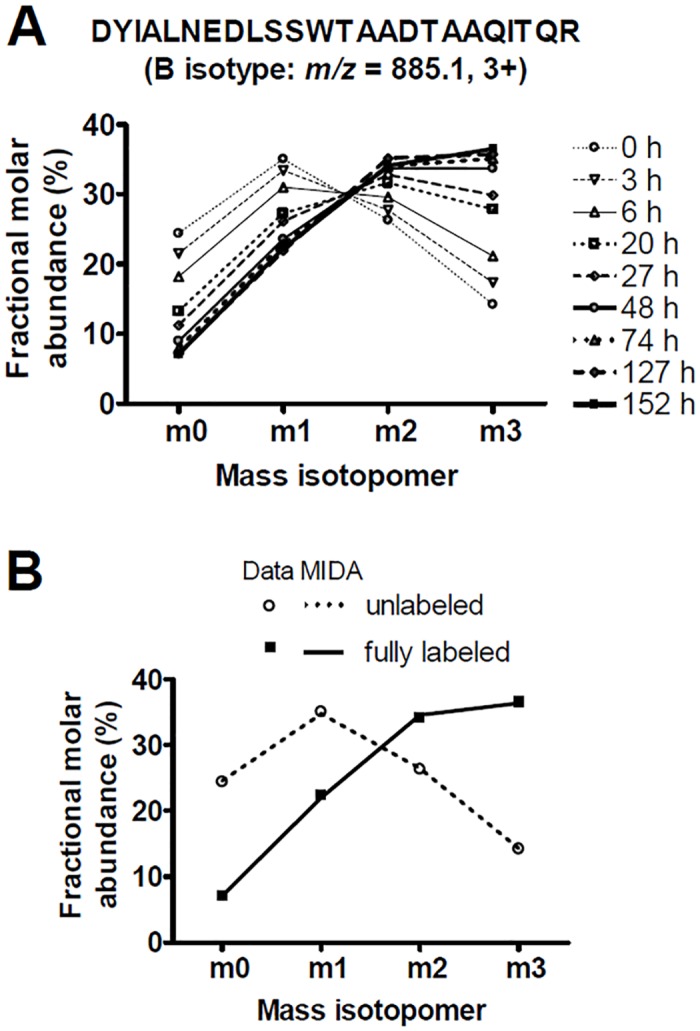
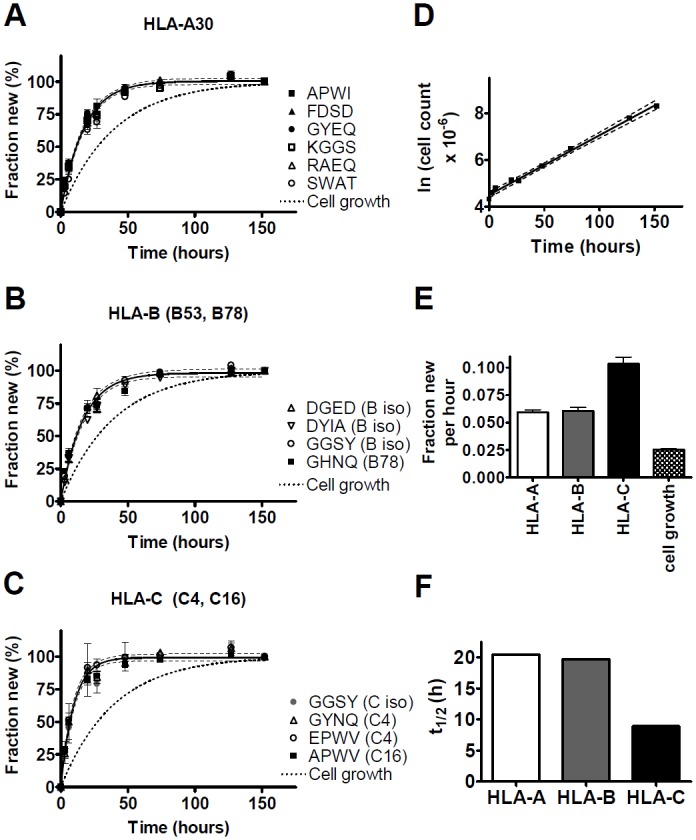
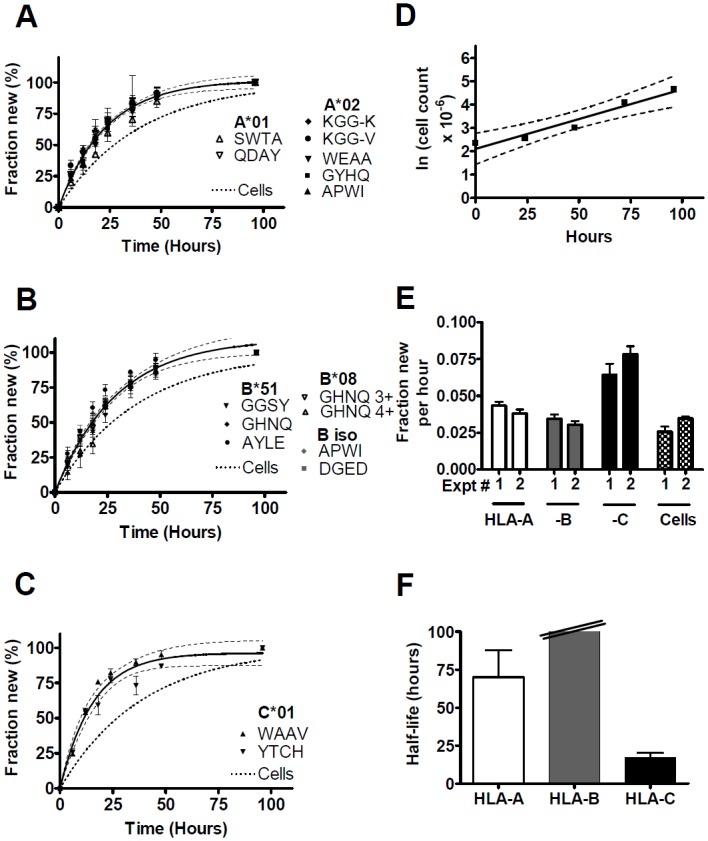
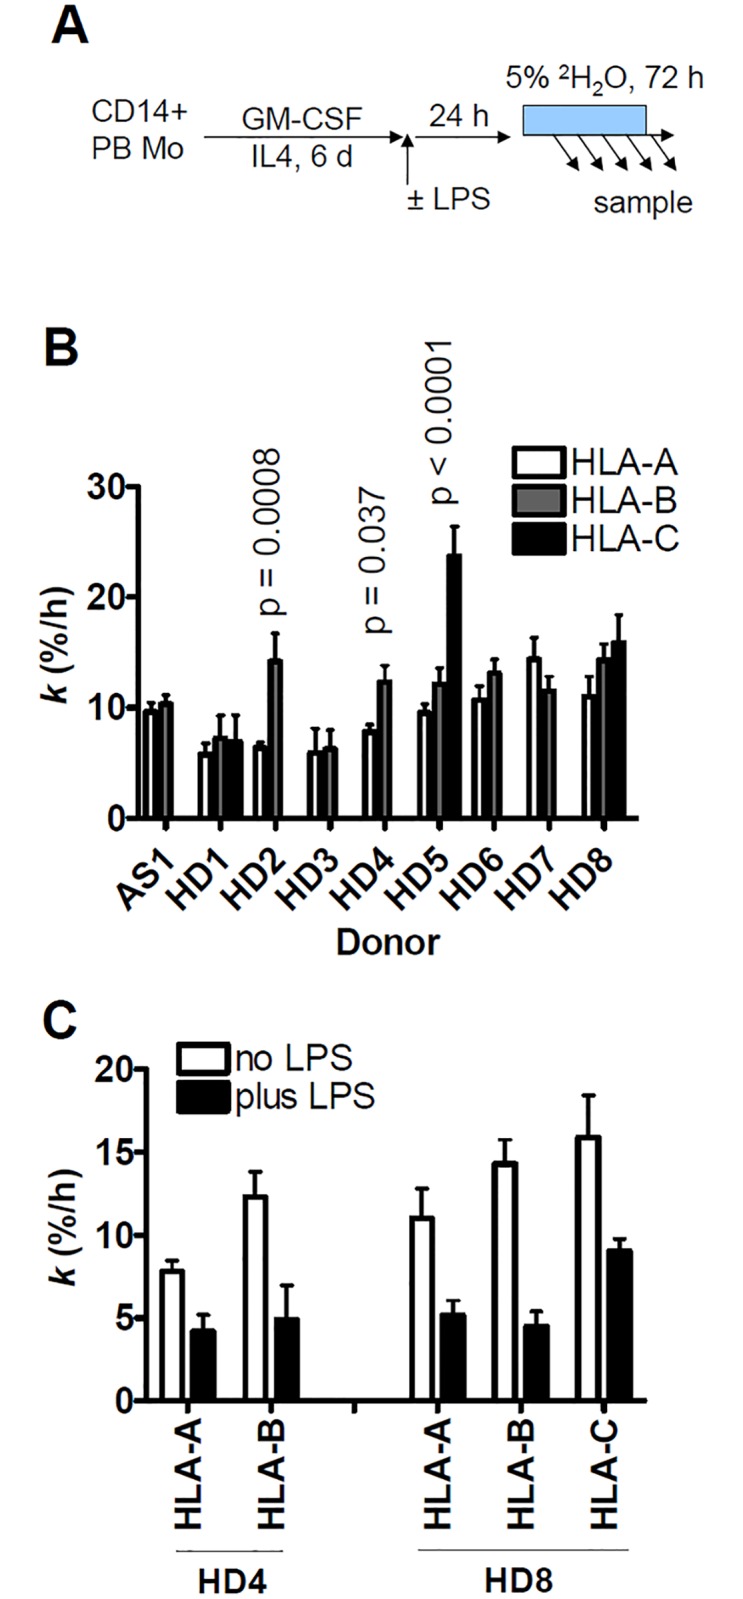
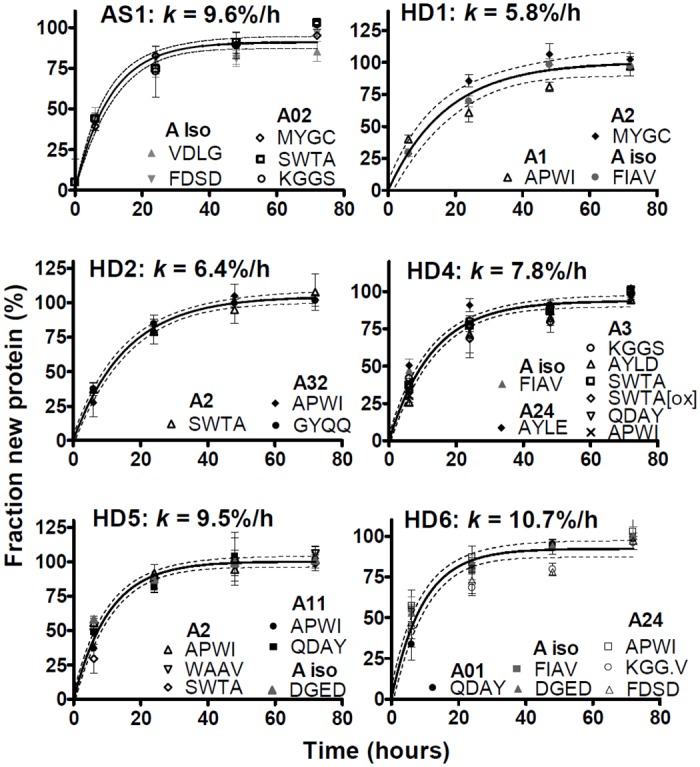
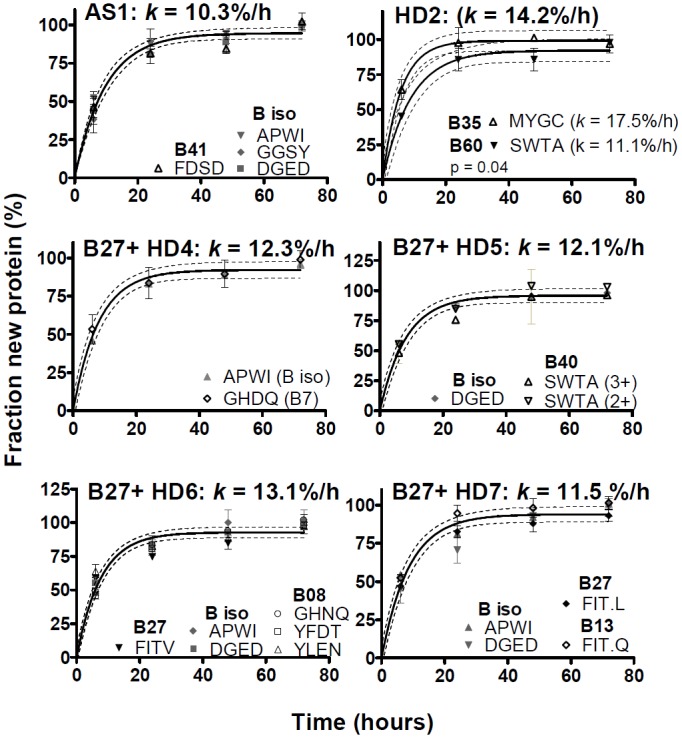
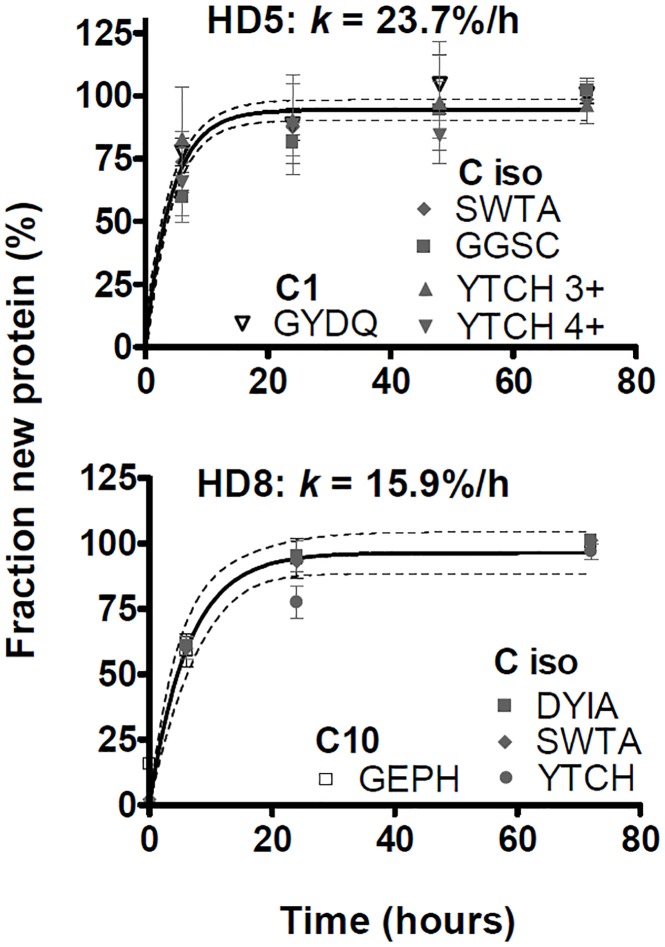
Major histocompatibility complex class I (MHCI) glycoproteins present cytosolic peptides to CD8+ T cells and regulate NK cell activity. Their heavy chains (HC) are expressed from up to three MHC gene loci (human leukocyte antigen [HLA]-A, -B, and -C in humans), whose extensive polymorphism maps predominantly to the antigen-binding groove, diversifying the bound peptide repertoire. Codominant expression of MHCI alleles is thus functionally critical, but how it is regulated is not fully understood. Here, we have examined the effect of polymorphism on the turnover rates of MHCI molecules in cell lines with functional MHCI peptide loading pathways and in monocyte-derived dendritic cells (MoDCs). Proteins were labeled biosynthetically with heavy water (2H2O), folded MHCI molecules immunoprecipitated, and tryptic digests analysed by mass spectrometry. MHCI-derived peptides were assigned to specific alleles and isotypes, and turnover rates quantified by 2H incorporation, after correcting for cell growth. MHCI turnover half-lives ranged from undetectable to a few hours, depending on cell type, activation state, donor, and MHCI isotype. However, in all settings, the turnover half-lives of alleles of the same isotype were similar. Thus, MHCI protein turnover rates appear to be allele-independent in normal human cells. We propose that this is an important feature enabling the normal function and codominant expression of MHCI alleles.
Conflict of interest statement
Figures
Similar articles
-
Sequence conservation analysis and in silico human leukocyte antigen-peptide binding predictions for the Mtb72F and M72 tuberculosis candidate vaccine antigens.BMC Immunol. 2015 Oct 22;16:63. doi: 10.1186/s12865-015-0119-7. BMC Immunol. 2015. PMID: 26493839 Free PMC article.
-
Human cytomegalovirus-encoded US2 differentially affects surface expression of MHC class I locus products and targets membrane-bound, but not soluble HLA-G1 for degradation.J Immunol. 2003 Dec 15;171(12):6757-65. doi: 10.4049/jimmunol.171.12.6757. J Immunol. 2003. PMID: 14662880
-
A systematic re-examination of processing of MHCI-bound antigenic peptide precursors by endoplasmic reticulum aminopeptidase 1.J Biol Chem. 2020 May 22;295(21):7193-7210. doi: 10.1074/jbc.RA120.012976. Epub 2020 Mar 17. J Biol Chem. 2020. PMID: 32184355 Free PMC article.
-
The multi-faceted nature of HLA class I dimer molecules.Immunology. 2012 Aug;136(4):380-4. doi: 10.1111/j.1365-2567.2012.03593.x. Immunology. 2012. PMID: 22533699 Free PMC article. Review.
-
HLA-E and HLA-E-bound peptides: recognition by subsets of NK and T cells.Curr Pharm Des. 2009;15(28):3336-44. doi: 10.2174/138161209789105207. Curr Pharm Des. 2009. PMID: 19860683 Review.
Cited by
-
Development of a Stable Peptide-Major Histocompatibility Complex (MHC) via Sortase and Click Chemistry.ACS Pharmacol Transl Sci. 2024 May 24;7(6):1746-1757. doi: 10.1021/acsptsci.3c00268. eCollection 2024 Jun 14. ACS Pharmacol Transl Sci. 2024. PMID: 38898944 Free PMC article.
-
HLA allele-specific expression: Methods, disease associations, and relevance in hematopoietic stem cell transplantation.Front Immunol. 2022 Sep 28;13:1007425. doi: 10.3389/fimmu.2022.1007425. eCollection 2022. Front Immunol. 2022. PMID: 36248878 Free PMC article. Review.
-
Most non-canonical proteins uniquely populate the proteome or immunopeptidome.Cell Rep. 2021 Mar 9;34(10):108815. doi: 10.1016/j.celrep.2021.108815. Cell Rep. 2021. PMID: 33691108 Free PMC article.
-
What Can Ribo-Seq, Immunopeptidomics, and Proteomics Tell Us About the Noncanonical Proteome?Mol Cell Proteomics. 2023 Sep;22(9):100631. doi: 10.1016/j.mcpro.2023.100631. Epub 2023 Aug 11. Mol Cell Proteomics. 2023. PMID: 37572790 Free PMC article.
-
What can Ribo-seq and proteomics tell us about the non-canonical proteome?bioRxiv [Preprint]. 2023 May 18:2023.05.16.541049. doi: 10.1101/2023.05.16.541049. bioRxiv. 2023. Update in: Mol Cell Proteomics. 2023 Sep;22(9):100631. doi: 10.1016/j.mcpro.2023.100631. PMID: 37292611 Free PMC article. Updated. Preprint.
References
-
- Murphy K, Travers P, Walport M. Janeway's Immunobiology. Seventh ed New York, NY: Garland Science, Taylor & Francis Group, LLC; 2008. 2008. 887 p.
-
- van den Elsen PJ, Holling TM, Kuipers HF, van der Stoep N. Transcriptional regulation of antigen presentation. Curr Opin Immunol. 2004;16(1):67–75. . - PubMed
-
- Momburg F, Roelse J, Howard JC, Butcher GW, Hammerling GJ, Neefjes JJ. Selectivity of MHC-encoded peptide transporters from human, mouse and rat. Nature. 1994;367(6464):648–51. . - PubMed
MeSH terms
Substances
Grants and funding
LinkOut - more resources
Full Text Sources
Other Literature Sources
Research Materials
