Review
. 2016 Aug 11;17(8):1313.
doi: 10.3390/ijms17081313.

Deep Artificial Neural Networks and Neuromorphic Chips for Big Data Analysis: Pharmaceutical and Bioinformatics Applications

Affiliations
Review

Deep Artificial Neural Networks and Neuromorphic Chips for Big Data Analysis: Pharmaceutical and Bioinformatics Applications

Lucas Antón Pastur-Romay et al. Int J Mol Sci. .

Abstract

Over the past decade, Deep Artificial Neural Networks (DNNs) have become the state-of-the-art algorithms in Machine Learning (ML), speech recognition, computer vision, natural language processing and many other tasks. This was made possible by the advancement in Big Data, Deep Learning (DL) and drastically increased chip processing abilities, especially general-purpose graphical processing units (GPGPUs). All this has created a growing interest in making the most of the potential offered by DNNs in almost every field. An overview of the main architectures of DNNs, and their usefulness in Pharmacology and Bioinformatics are presented in this work. The featured applications are: drug design, virtual screening (VS), Quantitative Structure-Activity Relationship (QSAR) research, protein structure prediction and genomics (and other omics) data mining. The future need of neuromorphic hardware for DNNs is also discussed, and the two most advanced chips are reviewed: IBM TrueNorth and SpiNNaker. In addition, this review points out the importance of considering not only neurons, as DNNs and neuromorphic chips should also include glial cells, given the proven importance of astrocytes, a type of glial cell which contributes to information processing in the brain. The Deep Artificial Neuron-Astrocyte Networks (DANAN) could overcome the difficulties in architecture design, learning process and scalability of the current ML methods.

Keywords: Quantitative Structure–Activity Relationship; artificial neural networks; artificial neuron–astrocyte networks; big data; deep learning; drug design; genomic medicine; neuromorphic chips; protein structure prediction; tripartite synapses.


Figures

Figure 1
Figure 1
Big Data Workflow.
Figure 2
Figure 2
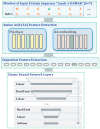
Deep neural network architecture from Yanjun Qi et al. [45]. The input to the first layer is the protein sequence represented by the single-letter amino acid code, for example the letter “A” (in green) represents “Alanine”. This method uses a sliding window input {S1, S2… Sk}, in this case k = 7. The first layer consists a PSI-Blast feature module and an amino acid embedding module, the green boxes represent the feature vector derived from the Alanine in both modules. In the second layer, the feature vectors are concatenated to facilitate identification of local sequence structure. Finally the derived vector is fed into the Deep Artificial Neural Network.
Figure 3
Figure 3
Convolutional layers that extract features of the input to create a feature map. The artificial neurons are represented by the circles, and the weights by the narrows. Weights of the same color are shared, constrained to be identical [56].
Figure 4
Figure 4
Architecture of a Deep Convolutional Neural Network (DCNN), alternating the convolutional layer and the max-pooling layer (or sub-sampling layer), and finally the fully-connected layer [56].
Figure 5
Figure 5
This diagram represents a simplification of the structure of the epoxidation model, which was made up of one input layer, two hidden layers, and two output layers. The actual model had several additional nodes in the input and hidden layers. In the input layer, M represents the molecule input node, B is the bond input node, and two atom input nodes (for each atom associated with the bond). The bond epoxidation score (BES) quantifies the probability that the bond is a site of epoxidation based in the input from the nodes of the first hidden layer (H1 and H2). The molecule epoxidation score (MES) reflects the probability that the molecule will be epoxidized. This score is calculated with the information from the all molecule-level descriptors and the BES. The bond network and the molecule network are represented in orange and purple respectively [57].
Figure 6
Figure 6
Details of inner workings of DeepBind developed by Alipanahi et al. and its training procedure. In “a”, five independent sequences of DNA are being processed in parallel, each composed by a string of letters (C, G, A and T) which represent the nucleotides. The scores are represented in white and red tones, and the outputs are compared to the targets to improve the model using backpropagation; In “b”, The Calibration, training, and tasting procedure is represented in more detail [59].
Figure 7
Figure 7
Different Recurrent Neural Networks architectures, the white circles represent the input layers, the black circles the hidden layers, and the grey circles the output layers [65].
Figure 8
Figure 8
Schematic diagram of Youjun Xu et al. network encoding glycine, first using primary canonical SMILES strucuture. Then, each of the atoms in the SMILES structure is sequentially defined as a root node. Finally, information for all other atoms is transferred along the shortest possible paths, in which case is obtained following the narrows [67].
Figure 9
Figure 9
Mapping a Deep Artificial Neural Network (DANN) (a) to a neuromorphic chip like the TrueNorth (b). The input neurons are represented with the red and white shapes (x and x’), and the output neurons with the grey shapes (z and z’). The weights (w) to the neuron z are approximated using a Pseudo Random Number Generator (PRNG), resulting in the weights (w’) to the neuron z’ in the neuromorphic chip [74].
Figure 10
Figure 10
(A) The neurosynaptic core is loosely inspired by the idea of a canonical cortical microcircuit; (B) A network of neurosynaptic cores is inspired by the cortex’s two-dimensional sheet, the brain regions are represented in different colors; (C) The multichip network is inspired by the long-range connections between cortical regions shown from the macaque brain; (DF) Structural scheme of the core, chip and multi-chip level. The white shapes represent axons (inputs) and the grey shapes the neurons (outputs); (GI) Functional view at different level; (JL) Image of the physical layout [77].
Figure 11
Figure 11
Mapping of a CNN to TrueNorth. (A) Convolutional network features for one group at one topographic location are implemented using neurons on the same TrueNorth core, with their corresponding filter support region implemented using the core’s input lines, and filter weights implemented using the core’s synaptic array. The inputs are represented with white shapes, and the grey triangles represent the neurons. The filter used in each case is implemented mapping the matrix of weights (the numbers in the green boxes) into the synaptic array (grey circles); (B) For a neuron (blue points) to target multiple core inputs, its output (orange points) must be replicated by neuron copies, recruited from other neurons on the same core, or on extra cores if needed [76].
Figure 12
Figure 12
Sparse coding applied to audio. In red 20 basis functions learned from unlabeled audio, in blue the functions from cat auditory nerve fibers [113].
Figure 13
Figure 13
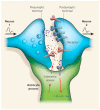
Tripartite synapse represented by a presynaptic neuron, postsynaptic neuron and perisynaptic astrocyte (astrocyte process). The presynaptic neuron release neurotransmitters that are received by the postsynaptic neuron or the perisynaptic astrocyte [129].

References

    1. Gawehn E., Hiss J.A., Schneider G. Deep learning in drug discovery. Mol. Inform. 2016;35:3–14. doi: 10.1002/minf.201501008. - DOI - PubMed
    1. Wesolowski M., Suchacz B. Artificial neural networks: Theoretical background and pharmaceutical applications: A review. J. AOAC Int. 2012;95:652–668. doi: 10.5740/jaoacint.SGE_Wesolowski_ANN. - DOI - PubMed
    1. Gertrudes J.C., Maltarollo V.G., Silva R.A., Oliveira P.R., Honório K.M., da Silva A.B.F. Machine learning techniques and drug design. Curr. Med. Chem. 2012;19:4289–4297. doi: 10.2174/092986712802884259. - DOI - PubMed
    1. Puri M., Pathak Y., Sutariya V.K., Tipparaju S., Moreno W. Artificial Neural Network for Drug Design, Delivery and Disposition. Elsevier Science; Amsterdam, The Netherlands: 2015.
    1. Yee L.C., Wei Y.C. Statistical Modelling of Molecular Descriptors in QSAR/QSPR. Volume 10. John Wiley & Sons; Hoboken, NJ, USA: 2012. Current modeling methods used in QSAR/QSPR; pp. 1–31.