. 2016 Aug 11;17(8):1316.
doi: 10.3390/ijms17081316.

Development of a Modular Assay for Detailed Immunophenotyping of Peripheral Human Whole Blood Samples by Multicolor Flow Cytometry

Affiliations

Development of a Modular Assay for Detailed Immunophenotyping of Peripheral Human Whole Blood Samples by Multicolor Flow Cytometry

Paul F Rühle et al. Int J Mol Sci. .

Abstract

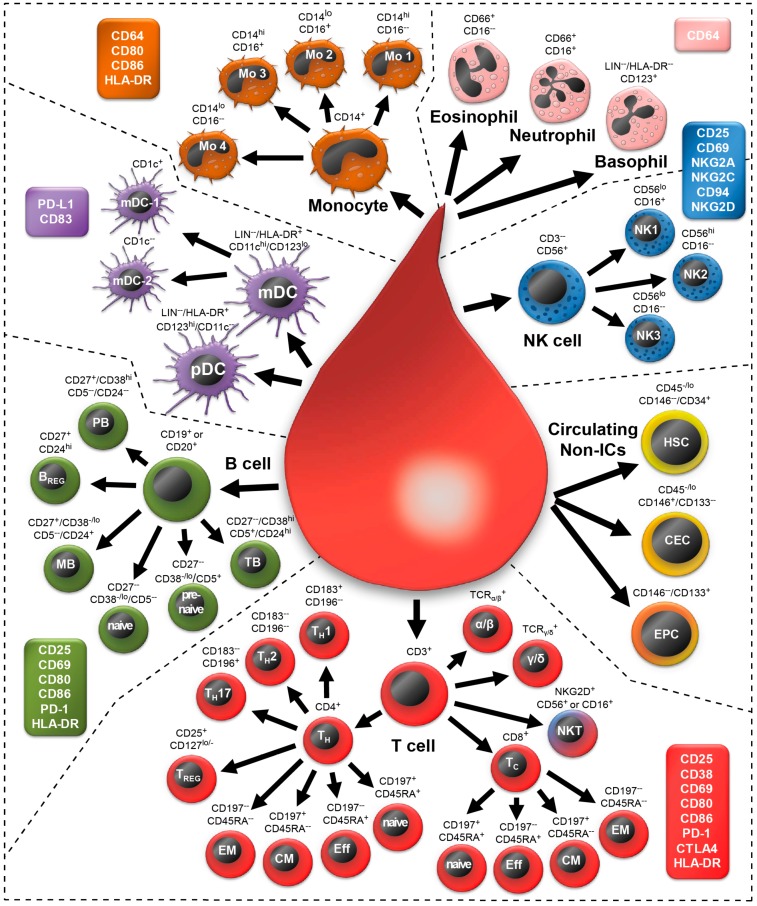
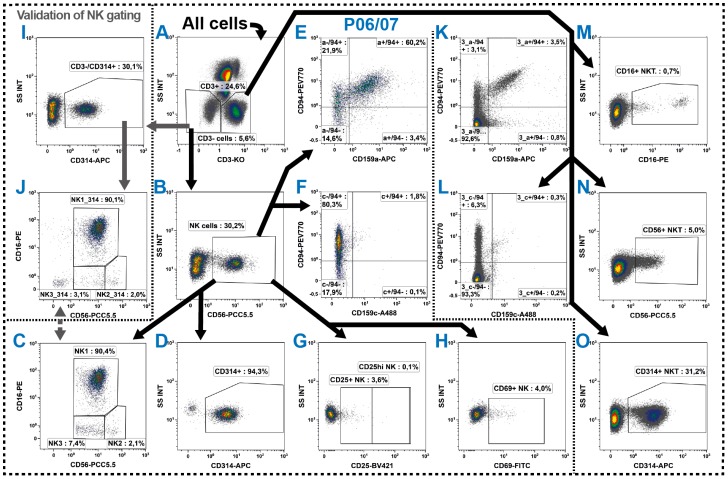
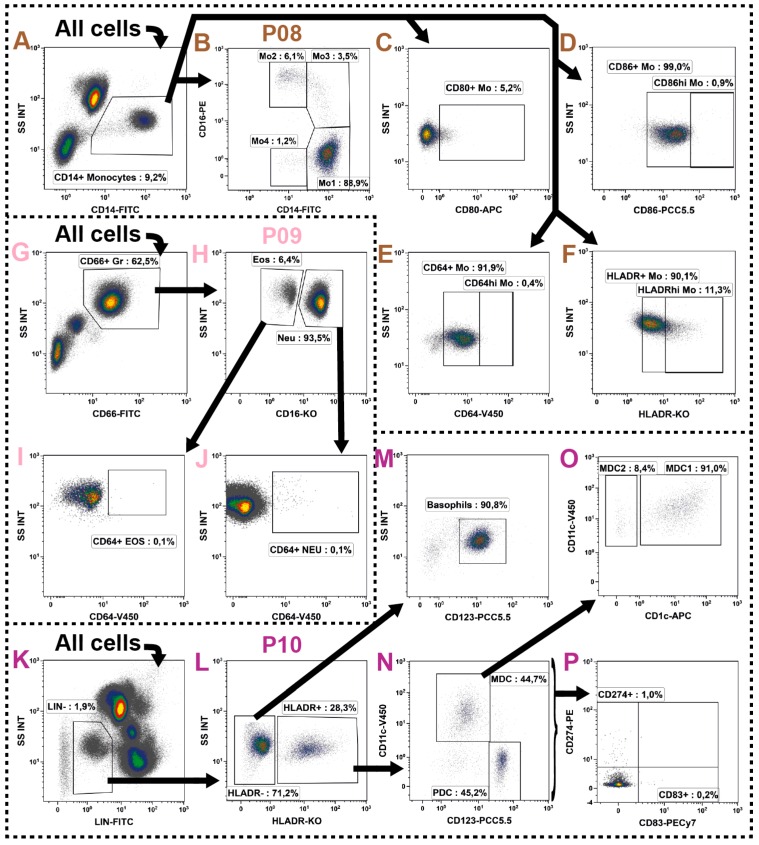
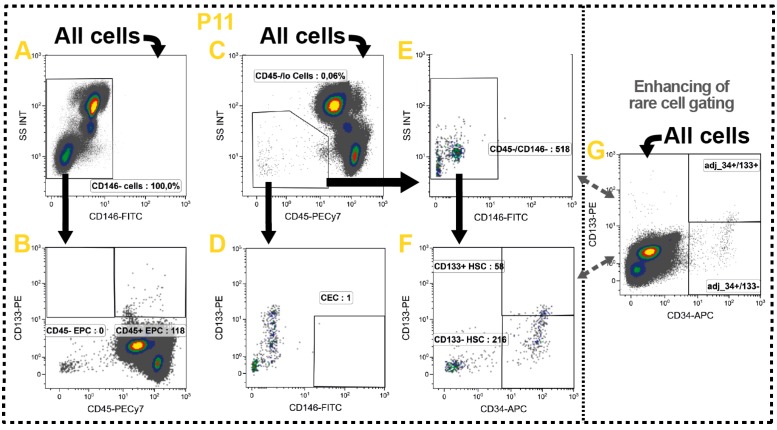
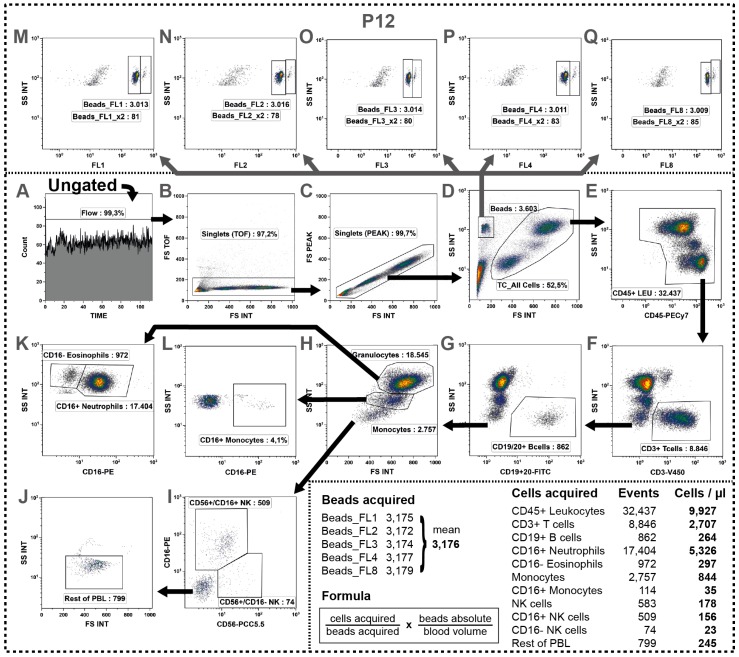
The monitoring of immune cells gained great significance in prognosis and prediction of therapy responses. For analyzing blood samples, the multicolor flow cytometry has become the method of choice as it combines high specificity on single cell level with multiple parameters and high throughput. Here, we present a modular assay for the detailed immunophenotyping of blood (DIoB) that was optimized for an easy and direct application in whole blood samples. The DIoB assay characterizes 34 immune cell subsets that circulate the peripheral blood including all major immune cells such as T cells, B cells, natural killer (NK) cells, monocytes, dendritic cells (DCs), neutrophils, eosinophils, and basophils. In addition, it evaluates their functional state and a few non-leukocytes that also have been associated with the outcome of cancer therapy. This DIoB assay allows a longitudinal and close-meshed monitoring of a detailed immune status in patients requiring only 2.0 mL of peripheral blood and it is not restricted to peripheral blood mononuclear cells. It is currently applied for the immune monitoring of patients with glioblastoma multiforme (IMMO-GLIO-01 trial, NCT02022384), pancreatic cancer (CONKO-007 trial, NCT01827553), and head and neck cancer (DIREKHT trial, NCT02528955) and might pave the way for immune biomarker identification for prediction and prognosis of therapy outcome.

Keywords: adaptive immune system; immune monitoring; immunophenotyping; innate immune system; liquid biopsy; multicolor flow cytometry; whole blood.


Figures

Figure 1
Figure 1
Schematic overview of the 34 immune cell and 3 non-immune cell subsets that can be identified by the here presented detailed immunophenotyping of blood (DIoB) assay. Whole blood samples were stained with specific antibody mixes in 11 different panels. Thus, all major circulating leukocytes such as T cells (red), B cells (green), dendritic cells (DC; violet: myeloid DC, plasmacytoid DC), monocytes (brown), granulocytes (pink: eosinophils, neutrophils, basophils), and natural killer (NK) cells (blue) were detected. Additionally, circulating non-immune cells (yellow/orange) such as hematopoietic stem cells (HSC), circulating endothelial cells (CEC) and endothelial progenitor cells (EPC) were monitored. These main cell types are depicted as bigger cells and all subsets, which were differentiated out of them, are depicted as smaller cells. For all of them, the markers that are necessary for their identification are indicated. This overview is completed by the enumeration of 27 activation markers which were assigned to corresponding cell types (colored boxes). The arrows represent the gating strategy in a simplified manner.
Figure 2
Figure 2
Definition of the All Cells-gate as crucial basis for the subset identifications by surface markers. (A) Acquisition characteristics were evaluated and irregularities were excluded by definition of Flow-gates for each panel; (B,C) Then, doublets were excluded by cross-checking the forward scatter (FSC) signal for its integral (INT) versus time of flight (TOF) and peak (PEAK) characteristics; (D) Finally, the All Cells-gate was defined based on its scatter characteristics. Hereby, the events that shifted to a lower FSC signal were considered as dead or dying cells and removed together with the debris from that definition; (E) The All Cells-gate could be subdivided on its scatter characteristics into granulocytes (GR), monocytes (MO) and lymphoid cells (PBL); and (AE) Black arrows represent the gating strategy and the depicted percentages depend on the respective input gate.
Figure 3
Figure 3
Gating strategy for the identification of fourteen T cell subsets and the determination of their activation state. (A) The T cells were identified by their CD3 expression defining the same gates for the panels P01, P02, P03 and P05; (BG) The P01 was used for the identification of TC and TH subsets; (B) Thus, first the TH and TC were identified by their differential CD4 and CD8 expression, whereby the TC were differentiated into CD8hi and CD8lo populations. Additionally, the double negative (DNT) and double positive (DPT) T cells were recorded; (CE) The TH, TC8hi and TC8lo were further distinguished into naïve, effector (Eff), effector memory (EM), and central memory (CM) subsets by their CD197 and CD45RA expression; (F,G) In order to determine the activation state of these subsets, the CD38 expression was examined; (H,I) In P02, the TH were differentiated into TH1, TH2, and TH17 by their CD186 and CD196 co-expressions; (J) In addition, the TREG were identified by their CD25hi/CD127-/lo phenotype; (K,L) The P03 was introduced for identification of the general TCR expression as well as the examination of the regulation of the immunosuppressive CTLA-4; (MR) Finally, the P05 investigated the activation state of T cells in general, examining the expression of CD25, CD69, CD80, CD86, and HLA-DR, as well as that of the CD279; and (AR) Black arrows represent the gating strategy and the depicted percentages depend on the respective input gate.
Figure 4
Figure 4
Gating strategy for the identification of six B cell subsets (P05: AI) and determination of their activation state (P06: KP). (A,B) For the definition of B cells, the expression of CD19 (A) and CD20 (B) was initially individually investigated, and then merged by the definition of a Boolean gate for subsequent analyses; (CH) Following, the subsets were characterized in a two-step process by their expression of CD27, CD38, CD5 and CD24; (C) First, a CD27 vs. CD38 quadrant was defined; (DG) Then, these four gates were investigated for their CD5 vs. CD24 co-expression allowing the definition of pre-naïve (D), naïve (D), memory (E) and transitional B cells (F) as well as plasmablasts (G); (H) All B cells not belonging to one of these subsets were defined as Rest of B cells by a Boolean gate and analyzed for their CD27+/CD24hi phenotype to identify the BREGs; (I) As B cells are sometimes sparsely distributed especially in cancer patients, the gate settings might be aligned comparing the expression patterns on PBL level; (JO) In addition, common activation markers were examined together with T cells in P05. Therefore, CD19 and CD20 were combined into one fluorescence channel (J). Then, the expression of CD25 (K), CD69 (L), CD80 (M), CD86 (N), and HLA-DR (O) was analyzed; and (AO) Black arrows represent the gating strategy and the depicted percentages depend on the respective input gate.
Figure 5
Figure 5
Gating strategy for the identification of three NK cell subsets (AC) and their functional states (DH), as well as several NKT cell subsets (KO). (AC) The NK cells were determined in P06 and P07 as CD3/CD56+ cells and subsequently distinguished into three subsets by their CD56 and CD16 co-expression into NK1, NK2 and NK3; (DF) Their cytotoxic activity was determined examining the expression of CD314, the suppressing CD159a and the activating CD159c, whereby the latter two were analyzed in co-expression to CD94; (G,H) In addition, their activation state was determined by examining the expression of CD25 and CD69; (I,J) As CD56 is generally low expressed, the NK cell identification was cross-checked by the CD314 expression on CD3 cells and also the three subsets were validated; (J,K) In parallel, NKT cells were determined as all CD3+ cells which simultaneously expressed one of the typical NK cell markers CD16, CD56, CD94, CD159a, CD159c or CD314; and (AO) Black arrows represent the gating strategy and the depicted percentages depend on the respective input gate.
Figure 6
Figure 6
Gating strategy for identification of myeloid cells such as monocytes (P08: AF), neutrophils and eosinophils (P09: GJ), as well as basophils and dendritic cells (P10: KO). (A,B) The monocytes were identified in P08 by their CD14 expression and subsequently distinguished into four subsets by their CD16 co-expression; (CF) For determination of their activation state, the expression of CD80, CD86, CD64 and HLA-DR was analyzed; (G,H) In P09 the neutrophils (Neu) and eosinophils (Eos) were identified by their shared expression of CD66 and high SSC characteristics, but differential CD16 expression; (I,J) Then, both cell populations were examined for their expression of CD64 as an activation marker. Here, attention should be paid to the high auto fluorescence characteristics of eosinophils; (K) In P10, the DCs and basophils were examined following the exclusion of most other cells by their lineage markers (LIN: CD3, CD14, CD16, CD19, CD20, CD56); (L,M) Then, the basophils were identified by their lack of HLA-DR while expressing CD123; (L,N) In contrast, the DCs express HLA-DR and can be distinguished by their differential expression of CD11c and CD123 into pDC and mDC; (O) The mDC were further divided into mDC-1 and mDC-2 by their differential expression of CD1c; (P) Finally, the maturation marker CD83 and the PD1 ligand CD274 (PD-L1) were determined on all DCs; and (AO) Black arrows represent the gating strategy and the depicted percentages depend on the respective input gate.
Figure 7
Figure 7
Gating strategy for the identification circulating non-leukocytes which have been associated with cancer therapy outcome. (A,B) The EPCs were identified by their lack of CD146 while expressing CD133 and directly divided into CD45+ and CD45 EPC; (C,D) The CECs express no or just little CD45 and lack CD133, but are positive for CD146; (C,E,F) Likewise, the HSC express no ore just little CD45, but lack CD146 and are positive for CD34. In the gating process they were directly distinguished into CD133 and 133+ HSC; (G) As all these cell types are very rare in most persons, the CD34 and CD133 gates were aligned according to its expression on the all cells level; and (AG) Black arrows represent the gating strategy and the depicted percentages depend on the respective input gate.
Figure 8
Figure 8
Determination of absolute cell counts by a simultaneous acquisition of cells and beads. (AD) Similar to all other panels, first irregularities were excluded from analysis, followed by doublet discrimination and the definition of the All Cells-gate; (EJ) Then, various major cells were determined keeping a strict gating order always excluding the already identified cell types from the next gating step by the use of Boolean gates (termed as Rest); (E) First, leukocytes were discriminated from debris by their CD45 expression; (F) Then, the CD3+ T cells were identified; (G) followed by B cell identification by their expression of CD19 or CD20 within the CD3cells; (H) Within the remaining cells the granulocytes and monocytes were detected by their particular scatter characteristics; (I) followed by detection of NK cells expressing CD56 and/or CD16; (Q) Then, all left-over cells were defined as Rest of cells containing non-determined cells such as DCs, basophils or HSCs; (K,L) Besides, the granulocytes and monocytes were further subdivided by their CD16 expression into eosinophils and neutrophils or CD16+ and CD16 monocytes respectively; (D) In parallel, the bead count was determined. Therefore, a Beads-gate was defined based on its dense scatter characteristics whereby it was important not to exclude the small beads together with debris; and (MQ). Then, these beads were verified by their auto fluorescence properties. We found two populations in the FL1, FL2, FL3, FL4 (blue laser) and FL8 (red laser) representing a major singlet and a minor doublet population. Consequently, for each channel we added the doublet population twice to the singlet population and calculated the mean value out of all five channels (see table at the bottom). Then, using the indicated formula, the absolute cell count per µL of initial blood was calculated for all acquired cells as shown for the representative example.
Figure 9
Figure 9
General robustness of the DIoB assay. Three whole blood samples of two different healthy donors were independently processed, measured and analyzed. These were analyzed by calculating the percentage distribution for 208 populations. Thereof, all populations counting for less than 100 events were excluded. In the analysis of these NHD blood samples 176 valid populations remained for determination of variations. Therefore, the coefficients of variation (CVs) were separately calculated for both samples. Then, the mean values were calculated representing the general robustness of the DIoB assay. The graph shows that the majority of populations (67%) had a CV below 5% and nearly all populations (93%) had a CV below 10%. Only 11 populations had a CV between 10% and 15% and one above 15%.

Similar articles

Cited by

References

    1. Galon J., Angell H.K., Bedognetti D., Marincola F.M. The continuum of cancer immunosurveillance: Prognostic, predictive, and mechanistic signatures. Immunity. 2013;39:11–26. - PubMed
    1. Derer A., Frey B., Fietkau R., Gaipl U.S. Immune-modulating properties of ionizing radiation: Rationale for the treatment of cancer by combination radiotherapy and immune checkpoint inhibitors. Cancer Immunol. Immunother. 2015;65:779–786. doi: 10.1007/s00262-015-1771-8. - DOI - PMC - PubMed
    1. Balermpas P., Rodel F., Liberz R., Oppermann J., Wagenblast J., Ghanaati S., Harter P.N., Mittelbronn M., Weiss C., Rodel C., et al. Head and neck cancer relapse after chemoradiotherapy correlates with CD163+ macrophages in primary tumour and CD11b+ myeloid cells in recurrences. Br. J. Cancer. 2014;111:1509–1518. doi: 10.1038/bjc.2014.446. - DOI - PMC - PubMed
    1. Ordonez R., Henriquez-Hernandez L.A., Federico M., Valenciano A., Pinar B., Lloret M., Bordon E., Rodriguez-Gallego C., Lara P.C. Radio-induced apoptosis of peripheral blood CD8 T lymphocytes is a novel prognostic factor for survival in cervical carcinoma patients. Strahlenther. Onkol. 2014;190:210–216. doi: 10.1007/s00066-013-0488-x. - DOI - PubMed
    1. Persa E., Balogh A., Safrany G., Lumniczky K. The effect of ionizing radiation on regulatory T cells in health and disease. Cancer Lett. 2015;368:252–261. - PubMed