

Disruption of visual circuit formation and refinement in a mouse model of autism
- PMID: 27529416
- PMCID: PMC5324550
- DOI: 10.1002/aur.1687
Disruption of visual circuit formation and refinement in a mouse model of autism
Abstract
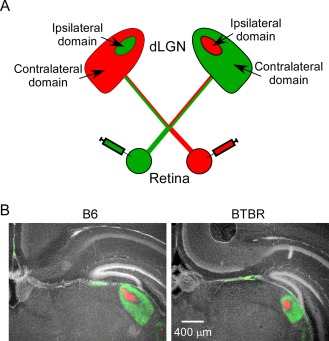
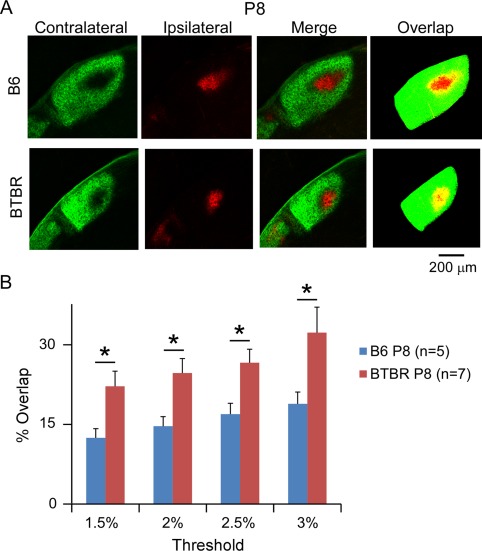
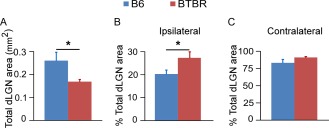
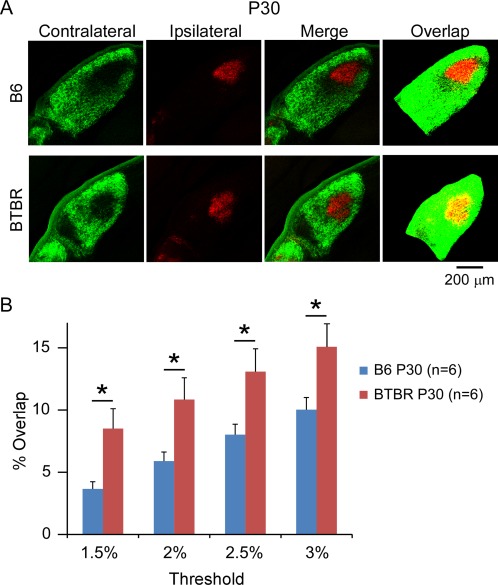
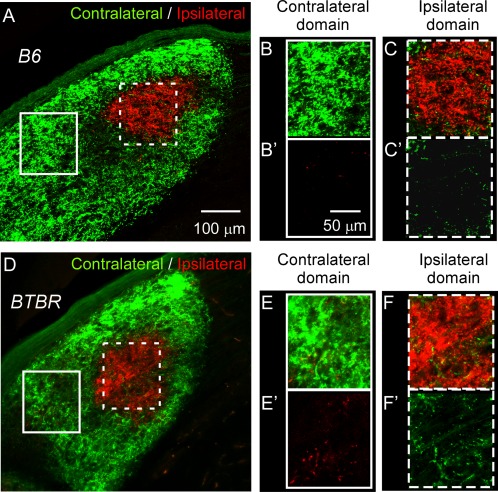
Aberrant connectivity is believed to contribute to the pathophysiology of autism spectrum disorder (ASD). Recent neuroimaging studies have increasingly identified such impairments in patients with ASD, including alterations in sensory systems. However, the cellular substrates and molecular underpinnings of disrupted connectivity remain poorly understood. Utilizing eye-specific segregation in the dorsal lateral geniculate nucleus (dLGN) as a model system, we investigated the formation and refinement of precise patterning of synaptic connections in the BTBR T + tf/J (BTBR) mouse model of ASD. We found that at the neonatal stage, the shape of the dLGN occupied by retinal afferents was altered in the BTBR group compared to C57BL/6J (B6) animals. Notably, the degree of overlap between the ipsi- and contralateral afferents was significantly greater in the BTBR mice. Moreover, these abnormalities continued into mature stage in the BTBR animals, suggesting persistent deficits rather than delayed maturation of axonal refinement. Together, these results indicate disrupted connectivity at the synaptic patterning level in the BTBR mice, suggesting that in general, altered neural circuitry may contribute to autistic behaviours seen in this animal model. In addition, these data are consistent with the notion that lower-level, primary processing mechanisms contribute to altered visual perception in ASD. Autism Res 2017, 10: 212-223. © 2016 The Authors Autism Research published by Wiley Periodicals, Inc. on behalf of International Society for Autism Research.
Keywords: BTBR mouse; autism spectrum disorder; brain circuit; eye-specific segregation; lateral geniculate nucleus; synaptic patterning; visual system.
© 2016 The Authors Autism Research published by Wiley Periodicals, Inc. on behalf of International Society for Autism Research.
Figures
Similar articles
-
The BTBR mouse model of idiopathic autism - Current view on mechanisms.Neurosci Biobehav Rev. 2017 May;76(Pt A):99-110. doi: 10.1016/j.neubiorev.2016.12.037. Epub 2017 Feb 3. Neurosci Biobehav Rev. 2017. PMID: 28167097 Free PMC article. Review.
-
Inbred strain preference in the BTBR T+ Itpr3tf /J mouse model of autism spectrum disorder: Does the stranger mouse matter in social approach?Autism Res. 2019 Aug;12(8):1184-1191. doi: 10.1002/aur.2158. Epub 2019 Jun 17. Autism Res. 2019. PMID: 31206258
-
Formation of functional areas in the cerebral cortex is disrupted in a mouse model of autism spectrum disorder.Neural Dev. 2015 Apr 3;10:10. doi: 10.1186/s13064-015-0033-y. Neural Dev. 2015. PMID: 25879444 Free PMC article.
-
The adenosine A2A receptor agonist, CGS 21680, attenuates a probabilistic reversal learning deficit and elevated grooming behavior in BTBR mice.Autism Res. 2018 Feb;11(2):223-233. doi: 10.1002/aur.1901. Epub 2017 Nov 29. Autism Res. 2018. PMID: 29193861
-
Auditory processing deficits in autism spectrum disorder: mechanisms, animal models, and therapeutic directions.J Neural Transm (Vienna). 2025 Jun;132(6):781-791. doi: 10.1007/s00702-025-02919-x. Epub 2025 May 12. J Neural Transm (Vienna). 2025. PMID: 40353881 Review.
Cited by
-
Early life oxytocin treatment improves thermo-sensory reactivity and maternal behavior in neonates lacking the autism-associated gene Magel2.Neuropsychopharmacology. 2022 Oct;47(11):1901-1912. doi: 10.1038/s41386-022-01313-5. Epub 2022 Apr 8. Neuropsychopharmacology. 2022. PMID: 35396500 Free PMC article.
-
Molecular Abnormalities in BTBR Mice and Their Relevance to Schizophrenia and Autism Spectrum Disorders: An Overview of Transcriptomic and Proteomic Studies.Biomedicines. 2023 Jan 20;11(2):289. doi: 10.3390/biomedicines11020289. Biomedicines. 2023. PMID: 36830826 Free PMC article.
-
Precocious myelination in a mouse model of autism.Transl Psychiatry. 2019 Oct 7;9(1):251. doi: 10.1038/s41398-019-0590-7. Transl Psychiatry. 2019. PMID: 31591392 Free PMC article.
-
The BTBR mouse model of idiopathic autism - Current view on mechanisms.Neurosci Biobehav Rev. 2017 May;76(Pt A):99-110. doi: 10.1016/j.neubiorev.2016.12.037. Epub 2017 Feb 3. Neurosci Biobehav Rev. 2017. PMID: 28167097 Free PMC article. Review.
-
Atypical visual processing in a mouse model of autism.Sci Rep. 2020 Jul 24;10(1):12390. doi: 10.1038/s41598-020-68589-9. Sci Rep. 2020. PMID: 32709898 Free PMC article.
References
MeSH terms
LinkOut - more resources
Full Text Sources
Other Literature Sources
Medical
Miscellaneous
