Exaggerated Increases in Microglia Proliferation, Brain Inflammatory Response and Sickness Behaviour upon Lipopolysaccharide Stimulation in Non-Obese Diabetic Mice
- PMID: 27529430
- PMCID: PMC5296925
- DOI: 10.1159/000446370
Exaggerated Increases in Microglia Proliferation, Brain Inflammatory Response and Sickness Behaviour upon Lipopolysaccharide Stimulation in Non-Obese Diabetic Mice
Abstract
The non-obese diabetic (NOD) mouse, an established model for autoimmune diabetes, shows an exaggerated reaction of pancreas macrophages to inflammatory stimuli. NOD mice also display anxiety when immune-stimulated. Chronic mild brain inflammation and a pro-inflammatory microglial activation is critical in psychiatric behaviour.
Objective: To explore brain/microglial activation and behaviour in NOD mice at steady state and after systemic lipopolysaccharide (LPS) injection.
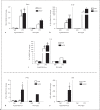
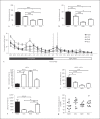
Methods: Affymetrix analysis on purified microglia of pre-diabetic NOD mice (8-10 weeks) and control mice (C57BL/6 and CD1 mice, the parental non-autoimmune strain) at steady state and after systemic LPS (100 μg/kg) administration. Quantitative PCR was performed on the hypothalamus for immune activation markers (IL-1β, IFNγ and TNFα) and growth factors (BDNF and PDGF). Behavioural profiling of NOD, CD1, BALB/c and C57BL/6 mice at steady state was conducted and sickness behaviour/anxiety in NOD and CD1 mice was monitored before and after LPS injection.
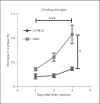
Results: Genome analysis revealed cell cycle/cell death and survival aberrancies of NOD microglia, substantiated as higher proliferation on BrdU staining. Inflammation signs were absent. NOD mice had a hyper-reactive response to novel environments with some signs of anxiety. LPS injection induced a higher expression of microglial activation markers, a higher brain pro-inflammatory set point (IFNγ, IDO) and a reduced expression of BDNF and PDGF after immune stimulation in NOD mice. NOD mice displayed exaggerated and prolonged sickness behaviour after LPS administration.
Conclusion: After stimulation with LPS, NOD mice display an increased microglial proliferation and an exaggerated inflammatory brain response with reduced BDNF and PDGF expression and increased sickness behaviour as compared to controls.
© 2016 S. Karger AG, Basel.
Figures


Similar articles
-
Peripheral lipopolysaccharide (LPS) challenge promotes microglial hyperactivity in aged mice that is associated with exaggerated induction of both pro-inflammatory IL-1beta and anti-inflammatory IL-10 cytokines.Brain Behav Immun. 2009 Mar;23(3):309-17. doi: 10.1016/j.bbi.2008.09.002. Epub 2008 Sep 12. Brain Behav Immun. 2009. PMID: 18814846 Free PMC article.
-
Long-term impact of systemic bacterial infection on the cerebral vasculature and microglia.J Neuroinflammation. 2012 Jun 27;9:146. doi: 10.1186/1742-2094-9-146. J Neuroinflammation. 2012. PMID: 22738332 Free PMC article.
-
Outbred ICR/CD1 mice display more severe neuroinflammation mediated by microglial TLR4/CD14 activation than inbred C57Bl/6 mice.Neuroscience. 2011 Sep 8;190:67-74. doi: 10.1016/j.neuroscience.2011.06.006. Epub 2011 Jun 13. Neuroscience. 2011. PMID: 21683771 Free PMC article.
-
Review: microglia of the aged brain: primed to be activated and resistant to regulation.Neuropathol Appl Neurobiol. 2013 Feb;39(1):19-34. doi: 10.1111/j.1365-2990.2012.01306.x. Neuropathol Appl Neurobiol. 2013. PMID: 23039106 Free PMC article. Review.
-
The influence of systemic inflammation on inflammation in the brain: implications for chronic neurodegenerative disease.Brain Behav Immun. 2004 Sep;18(5):407-13. doi: 10.1016/j.bbi.2004.01.004. Brain Behav Immun. 2004. PMID: 15265532 Review.
Cited by
-
Assessing the Anti-Inflammatory Activity of the Anxiolytic Drug Buspirone Using CRISPR-Cas9 Gene Editing in LPS-Stimulated BV-2 Microglial Cells.Cells. 2021 May 25;10(6):1312. doi: 10.3390/cells10061312. Cells. 2021. PMID: 34070429 Free PMC article.
-
IRF2BP2-deficient microglia block the anxiolytic effect of enhanced postnatal care.Sci Rep. 2017 Aug 29;7(1):9836. doi: 10.1038/s41598-017-10349-3. Sci Rep. 2017. PMID: 28852125 Free PMC article.
-
Neuronal protein-tyrosine phosphatase 1B hinders sensory-motor functional recovery and causes affective disorders in two different focal ischemic stroke models.Neural Regen Res. 2021 Jan;16(1):129-136. doi: 10.4103/1673-5374.286970. Neural Regen Res. 2021. PMID: 32788467 Free PMC article.
-
Experimental colitis reduces microglial cell activation in the mouse brain without affecting microglial cell numbers.Sci Rep. 2019 Dec 27;9(1):20217. doi: 10.1038/s41598-019-56859-0. Sci Rep. 2019. PMID: 31882991 Free PMC article.
-
Effects of diabetes on microglial physiology: a systematic review of in vitro, preclinical and clinical studies.J Neuroinflammation. 2023 Mar 3;20(1):57. doi: 10.1186/s12974-023-02740-x. J Neuroinflammation. 2023. PMID: 36869375 Free PMC article.
References
-
- Homo-Delarche F. Neuroendocrine immuno-ontogeny of the pathogenesis of autoimmune disease in the nonobese diabetic (NOD) mouse. ILAR J. 2004;45:237–258. - PubMed
-
- Nikolic T, Bunk M, Drexhage HA, Leenen PJ. Bone marrow precursors of nonobese diabetic mice develop into defective macrophage-like dendritic cells in vitro. J Immunol. 2004;173:4342–4351. - PubMed
-
- Charre S, Rosmalen JG, Pelegri C, Alves V, Leenen PJ, Drexhage HA, Homo-Delarche F. Abnormalities in dendritic cell and macrophage accumulation in the pancreas of nonobese diabetic (NOD) mice during the early neonatal period. Histol Histopathol. 2002;17:393–401. - PubMed
MeSH terms
Substances
LinkOut - more resources
Full Text Sources
Other Literature Sources
Research Materials

