

Acute tumour response to a bispecific Ang-2-VEGF-A antibody: insights from multiparametric MRI and gene expression profiling
- PMID: 27529514
- PMCID: PMC5023775
- DOI: 10.1038/bjc.2016.236
Acute tumour response to a bispecific Ang-2-VEGF-A antibody: insights from multiparametric MRI and gene expression profiling
Abstract
Background: To assess antivascular effects, and evaluate clinically translatable magnetic resonance imaging (MRI) biomarkers of tumour response in vivo, following treatment with vanucizumab, a bispecific human antibody against angiopoietin-2 (Ang-2) and vascular endothelial growth factor-A (VEGF-A).
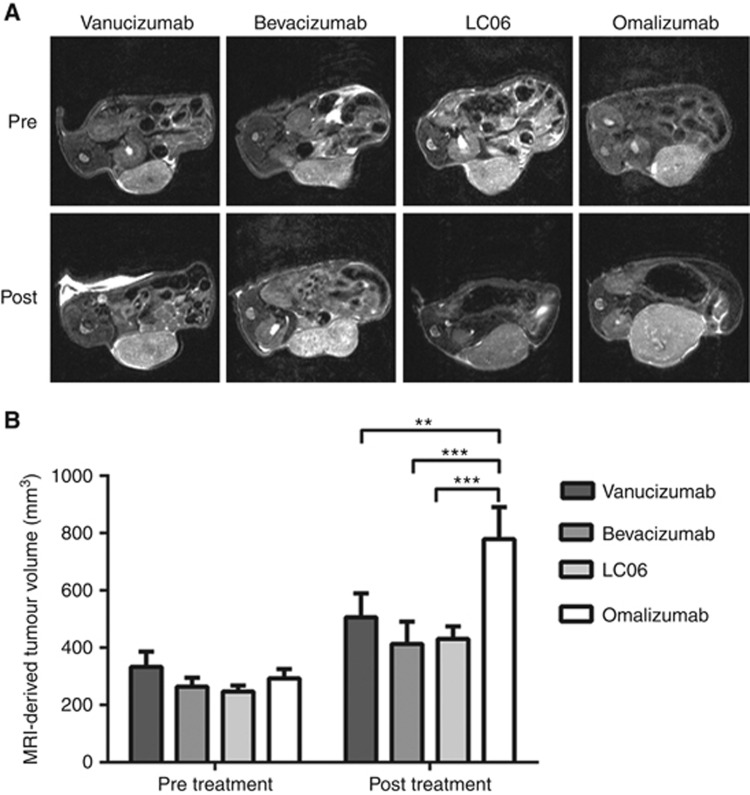
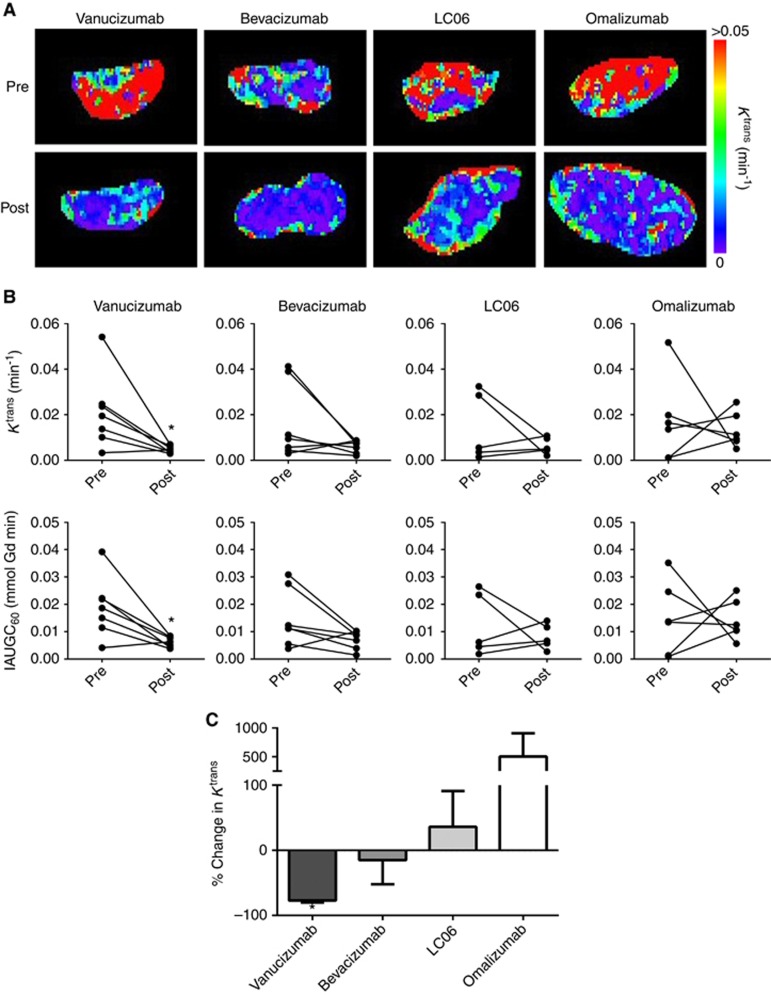
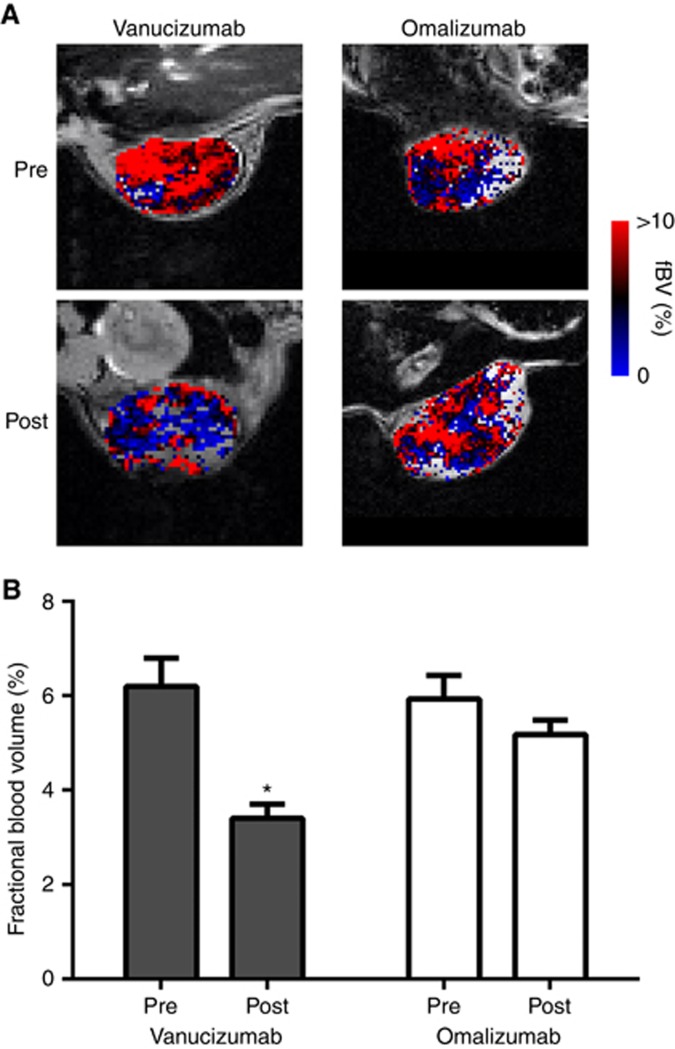
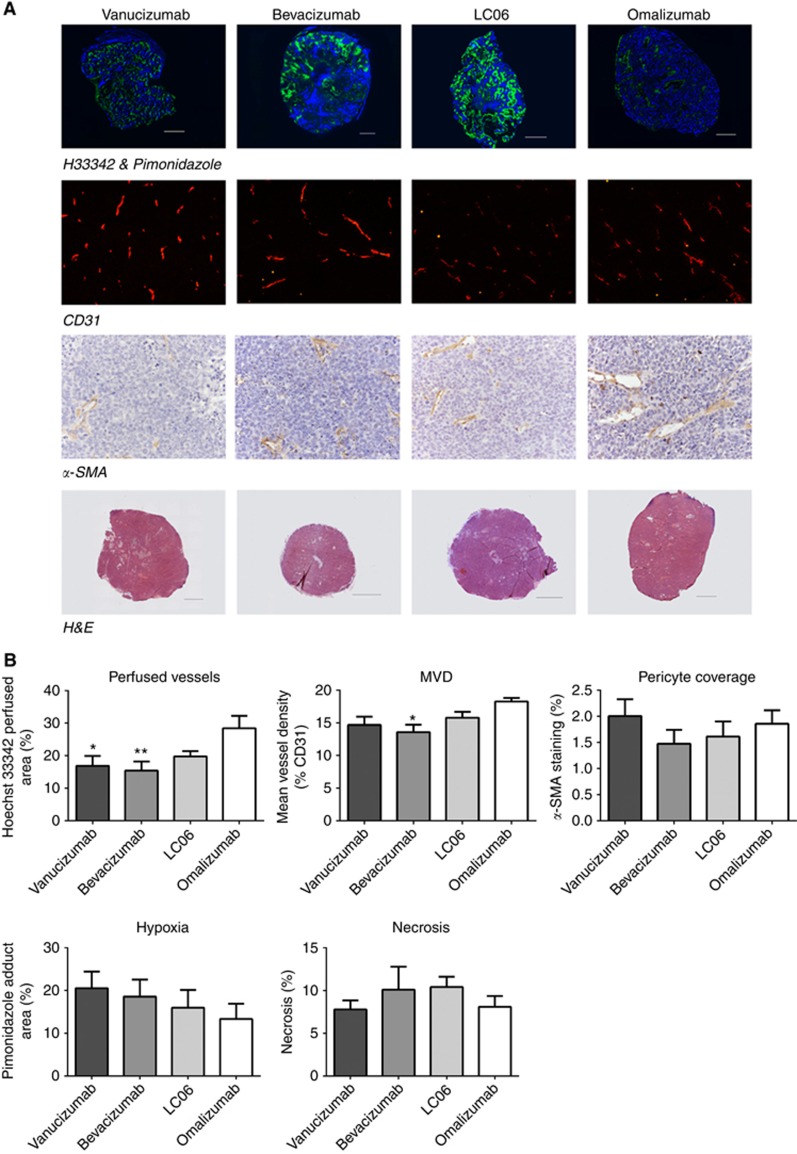
Methods: Colo205 colon cancer xenografts were imaged before and 5 days after treatment with a single 10 mg kg(-1) dose of either vanucizumab, bevacizumab (anti-human VEGF-A), LC06 (anti-murine/human Ang-2) or omalizumab (anti-human IgE control). Volumetric response was assessed using T2-weighted MRI, and diffusion-weighted, dynamic contrast-enhanced (DCE) and susceptibility contrast MRI used to quantify tumour water diffusivity (apparent diffusion coefficient (ADC), × 10(6) mm(2) s(-1)), vascular perfusion/permeability (K(trans), min(-1)) and fractional blood volume (fBV, %) respectively. Pathological correlates were sought, and preliminary gene expression profiling performed.
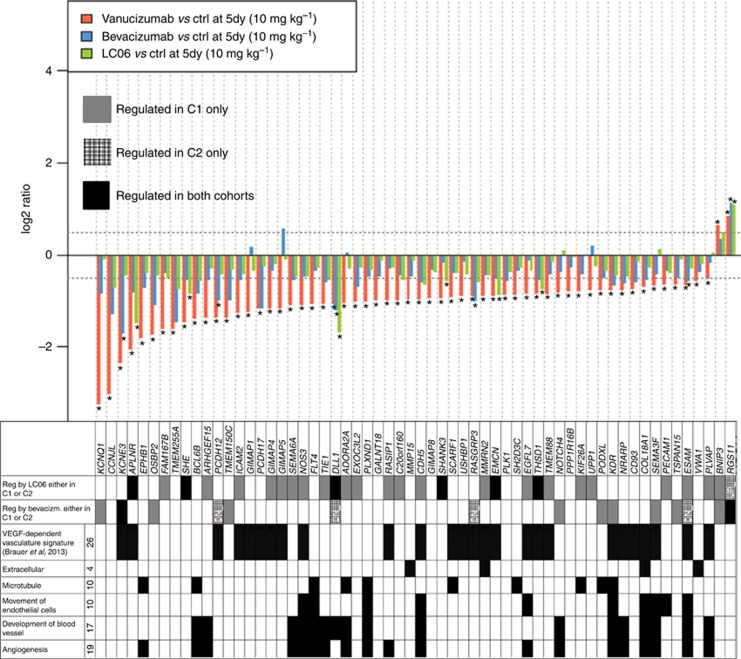
Results: Treatment with vanucizumab, bevacizumab or LC06 induced a significant (P<0.01) cytolentic response compared with control. There was no significant change in tumour ADC in any treatment group. Uptake of Gd-DTPA was restricted to the tumour periphery in all post-treatment groups. A significant reduction in tumour K(trans) (P<0.05) and fBV (P<0.01) was determined 5 days after treatment with vanucizumab only. This was associated with a significant (P<0.05) reduction in Hoechst 33342 uptake compared with control. Gene expression profiling identified 20 human genes exclusively regulated by vanucizumab, 6 of which are known to be involved in vasculogenesis and angiogenesis.
Conclusions: Vanucizumab is a promising antitumour and antiangiogenic treatment, whose antivascular activity can be monitored using DCE and susceptibility contrast MRI. Differential gene expression in vanucizumab-treated tumours is regulated by the combined effect of Ang-2 and VEGF-A inhibition.
Figures
Similar articles
-
First-in-Human Phase I Study of Single-agent Vanucizumab, A First-in-Class Bispecific Anti-Angiopoietin-2/Anti-VEGF-A Antibody, in Adult Patients with Advanced Solid Tumors.Clin Cancer Res. 2018 Apr 1;24(7):1536-1545. doi: 10.1158/1078-0432.CCR-17-1588. Epub 2017 Dec 7. Clin Cancer Res. 2018. PMID: 29217526 Clinical Trial.
-
Ang-2-VEGF-A CrossMab, a novel bispecific human IgG1 antibody blocking VEGF-A and Ang-2 functions simultaneously, mediates potent antitumor, antiangiogenic, and antimetastatic efficacy.Clin Cancer Res. 2013 Dec 15;19(24):6730-40. doi: 10.1158/1078-0432.CCR-13-0081. Epub 2013 Oct 4. Clin Cancer Res. 2013. PMID: 24097868
-
Efficacy of a Bispecific Antibody Co-Targeting VEGFA and Ang-2 in Combination with Chemotherapy in a Chemoresistant Colorectal Carcinoma Xenograft Model.Molecules. 2019 Aug 7;24(16):2865. doi: 10.3390/molecules24162865. Molecules. 2019. PMID: 31394786 Free PMC article.
-
Vascular endothelial growth factor inhibitors in colon cancer.Adv Exp Med Biol. 2006;587:251-75. doi: 10.1007/978-1-4020-5133-3_20. Adv Exp Med Biol. 2006. PMID: 17163170 Review.
-
Targeting angiogenesis in esophagogastric adenocarcinoma.Oncologist. 2011;16(6):844-58. doi: 10.1634/theoncologist.2010-0387. Epub 2011 May 31. Oncologist. 2011. PMID: 21632459 Free PMC article. Review.
Cited by
-
Trial Watch: Immunostimulatory monoclonal antibodies for oncological indications.Oncoimmunology. 2017 Aug 30;6(12):e1371896. doi: 10.1080/2162402X.2017.1371896. eCollection 2017. Oncoimmunology. 2017. PMID: 29209572 Free PMC article. Review.
-
A Review of Anti-Angiogenic Targets for Monoclonal Antibody Cancer Therapy.Int J Mol Sci. 2017 Aug 17;18(8):1786. doi: 10.3390/ijms18081786. Int J Mol Sci. 2017. PMID: 28817103 Free PMC article. Review.
-
Evaluating Imaging Biomarkers of Acquired Resistance to Targeted EGFR Therapy in Xenograft Models of Human Head and Neck Squamous Cell Carcinoma.Front Oncol. 2018 Jul 23;8:271. doi: 10.3389/fonc.2018.00271. eCollection 2018. Front Oncol. 2018. PMID: 30083516 Free PMC article.
-
Differential Effects of Ang-2/VEGF-A Inhibiting Antibodies in Combination with Radio- or Chemotherapy in Glioma.Cancers (Basel). 2019 Mar 6;11(3):314. doi: 10.3390/cancers11030314. Cancers (Basel). 2019. PMID: 30845704 Free PMC article.
-
Ten years in the making: application of CrossMab technology for the development of therapeutic bispecific antibodies and antibody fusion proteins.MAbs. 2021 Jan-Dec;13(1):1967714. doi: 10.1080/19420862.2021.1967714. MAbs. 2021. PMID: 34491877 Free PMC article. Review.
References
-
- Bashir MR, Bhatti L, Marin D, Nelson RC (2015) Emerging applications for ferumoxytol as a contrast agent in MRI. J Magn Reson Imaging 41: 884–898. - PubMed
-
- Batchelor T, Sorensen A, di Tomaso E, Zhang W, Duda D, Cohen K, Kozak K, Cahill D, Chen P, Zhu M, Ancukiewicz M, Mrugala M, Plotkin S, Drappatz J, Louis D, Ivy P, Scadden D, Benner T, Loeffler J, Wen P, Jain R (2007) AZD2171, a pan-VEGF receptor tyrosine kinase inhibitor, normalizes tumor vasculature and alleviates edema in glioblastoma patients. Cancer Cell 11: 83–95. - PMC - PubMed
-
- Bessho H, Wong B, Huang D, Tan J, Ong CK, Iwamura M, Hart S, Dangl M, Thomas M, Teh BT (2015) Effect of Ang-2-VEGF-A bispecific antibody in renal cell carcinoma. Cancer Invest 33: 378–386. - PubMed
MeSH terms
Substances
Grants and funding
LinkOut - more resources
Full Text Sources
Other Literature Sources
Medical
Miscellaneous
