. 2016 Aug 16:7:12461.
doi: 10.1038/ncomms12461.

Fishing down nutrients on coral reefs

Affiliations

Fishing down nutrients on coral reefs

Jacob E Allgeier et al. Nat Commun. .

Abstract

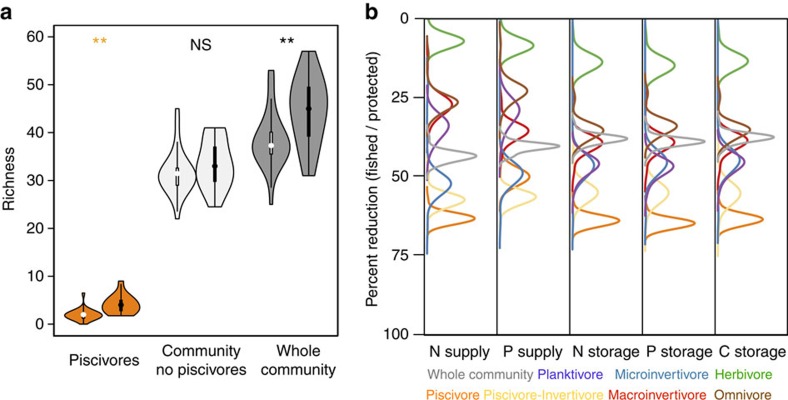
Fishing is widely considered a leading cause of biodiversity loss in marine environments, but the potential effect on ecosystem processes, such as nutrient fluxes, is less explored. Here, we test how fishing on Caribbean coral reefs influences biodiversity and ecosystem functions provided by the fish community, that is, fish-mediated nutrient capacity. Specifically, we modelled five processes of nutrient storage (in biomass) and supply (via excretion) of nutrients, as well as a measure of their multifunctionality, onto 143 species of coral reef fishes across 110 coral reef fish communities. These communities span a gradient from extreme fishing pressure to protected areas with little to no fishing. We find that in fished sites fish-mediated nutrient capacity is reduced almost 50%, despite no substantial changes in the number of species. Instead, changes in community size and trophic structure were the primary cause of shifts in ecosystem function. These findings suggest that a broader perspective that incorporates predictable impacts of fishing pressure on ecosystem function is imperative for effective coral reef conservation and management.


Figures

Figure 1
Figure 1. The relative importance of different aspects of community structure for fish nutrient capacity.
(a) Bars indicate mean weighted parameter estimates (for models with ΔAIC<5) for mixed-effects model (with random intercepts for reef type and site nested within country; n=110) for six nutrient processes and M (multifunctionality). All models included six parameters: species richness (richness), species evenness (SD–reciprocal Simpson's index), Trophic Group evenness (TG), mean biomass-weighted trophic level (TL), mean maximum size per species (Max Length) and skewness of the size frequency distribution of the community (Skewness). Colours denote the different parameters of interest. ‘+' or ‘−' distinguish the direction of the response for parameters that were within the top model and for which the 95% confidence intervals do not overlap zero. (b) Mean weighted parameter estimates (for models with ΔAIC<5) for the same processes as in panel (a), but here corrected for relative biomass (n=110).
Figure 2
Figure 2. The relative importance of factors influencing fish nutrient capacity on reefs.
(a) Bars indicate mean weighted parameter estimates for mixed-effects models (with random intercepts for reef type and country; n=39) for six ecosystem functions and M (multifunctionality). Predictor variables are arranged by colour and include: protection status–either fished or enforced protection (Protection; dark blue), distance to the nearest population settlement (Pop. Density; light blue), size of marine protected area (PA area; peach), total size of reef tract within 5 km radius of the surveyed site (Reef area; white) and area of cultivated land within 50 km–a proxy for terrestrial runoff (Agriculture; red). Colours denote the different parameters of interest. ‘+' or ‘−' distinguish the direction of the response for parameters that were within the top model and for which the 95% confidence intervals do not overlap zero. (b) Examples of relationships between N supply and storage and the most important continuous predictor–human population density (n=39). R2 values are for the mixed-effects model including only population density as a fixed effect. Grey bands indicate 95% confidence intervals. Symbols indicate different reef type (spur and grove=circle, wall=triangle and slope=diamond) and symbol size indicates relative size of protected area. Colours in all plots indicate protection status (light green=fished, dark green=protected). Barplots show differences between reefs that experience fishing (F) and are protected (NF)–all differences are significant. Error bars indicate s.e.
Figure 3
Figure 3. Effects of fishing on species richness and contribution of trophic groups for nutrient supply and storage.
(a) The number of species lost due to fishing in various components of the community: piscivores only, the community minus piscivores and the whole community. Violin bars with a white centre bar indicate reefs on which fishing occurs versus a black centre bar indicating protected reefs (n=39 total communities). ‘**' and ‘NS' indicate statistical significance, and lack of significance, respectively, as determined by 95% confidence intervals overlap with zero from mixed-effects models. (b) Distributions of effect sizes illustrating the relative degree to which fishing reduces the supply and storage of nutrients by different trophic groups. Distributions represent bootstrapped (1000 iterations) per cent reductions in nutrient processes for each trophic group (n=7) between fished and protected reefs (n=39) (Supplemental Information: Human impacts analysis).

References

    1. Loreau M. et al.. Biodiversity and ecosystem functioning: current knowledge and future challenges. Science 294, 804–808 (2001). - PubMed
    1. Duffy J. E. Why biodiversity is important to the functioning of real-world ecosystems. Front. Ecol. Environ. 7, 437–444 (2009).
    1. Estes J. A. et al.. Trophic downgrading of planet earth. Science 333, 301–306 (2011). - PubMed
    1. DeAngelis D. L. Dynamics of Nutrient Cycling and Food Webs Chapman and Hall (1992).
    1. Hatcher B. G. Coral reef primary productivity–a hierarchy of patterns and process. Trends Ecol. Evol. 5, 149–155 (1990). - PubMed

Publication types

LinkOut - more resources