. 2016 Sep:252:136-146.
doi: 10.1016/j.atherosclerosis.2016.07.930. Epub 2016 Aug 1.

Endothelial glycocalyx, apoptosis and inflammation in an atherosclerotic mouse model

Affiliations

Endothelial glycocalyx, apoptosis and inflammation in an atherosclerotic mouse model

Limary M Cancel et al. Atherosclerosis. 2016 Sep.

Abstract

Background and aims: Previous experiments suggest that both increased endothelial cell apoptosis and endothelial surface glycocalyx shedding could play a role in the endothelial dysfunction and inflammation of athero-prone regions of the vasculature. We sought to elucidate the possibly synergistic mechanisms by which endothelial cell apoptosis and glycocalyx shedding promote atherogenesis.

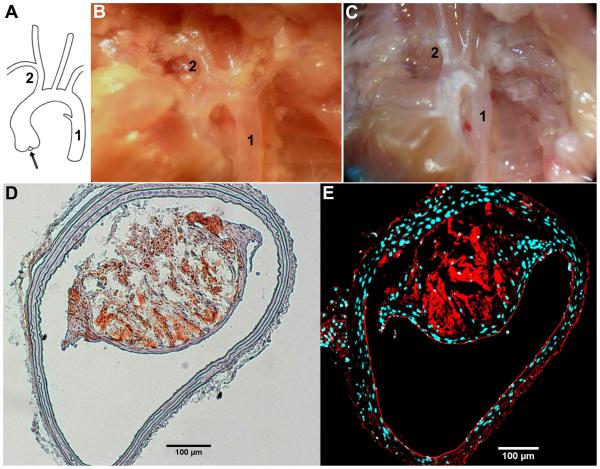
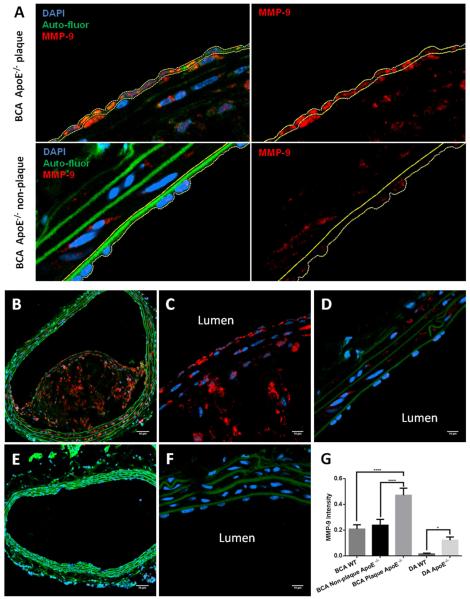
Methods: 4- to 6-week old male C57Bl/6 apolipoprotein E knockout (ApoE(-/-)) mice were fed a Western diet for 10 weeks and developed plaques in their brachiocephalic arteries.

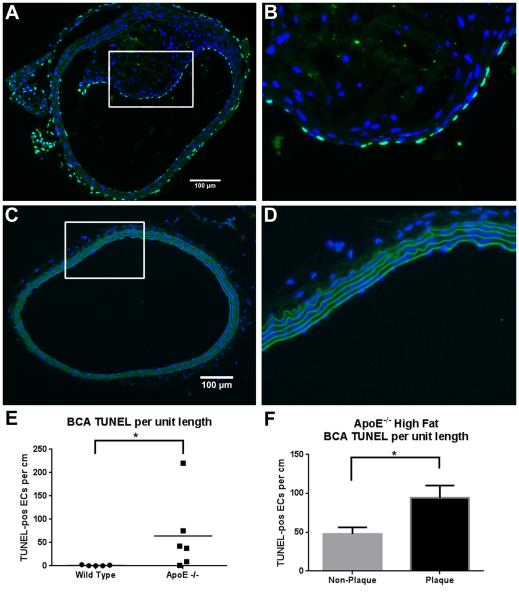
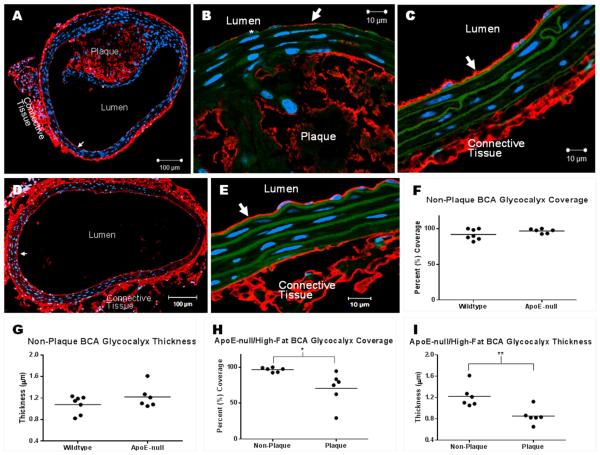
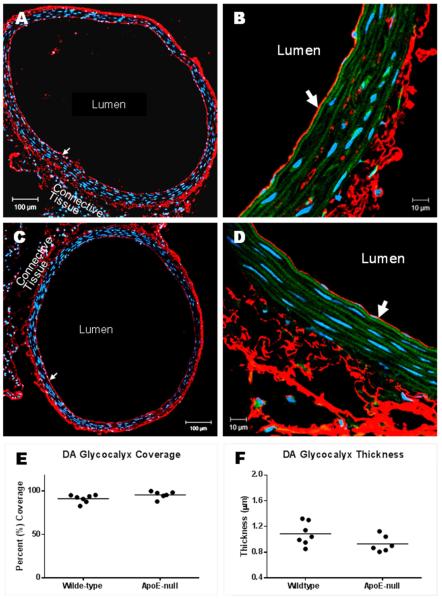
Results: Glycocalyx coverage and thickness were significantly reduced over the plaque region compared to the non-plaque region (coverage plaque: 71 ± 23%, non-plaque: 97 ± 3%, p = 0.02; thickness plaque: 0.85 ± 0.15 μm, non-plaque: 1.2 ± 0.21 μm, p = 0.006). Values in the non-plaque region were not different from those found in wild type mice fed a normal diet (coverage WT: 92 ± 3%, p = 0.7 vs. non-plaque ApoE(-/-), thickness WT: 1.1 ± 0.06 μm, p = 0.2 vs. non-plaque ApoE(-/-)). Endothelial cell apoptosis was significantly increased in ApoE(-/-) mice compared to wild type mice (ApoE(-/-):64.3 ± 33.0, WT: 1.1 ± 0.5 TUNEL-pos/cm, p = 2 × 10(-7)). The number of apoptotic endothelial cells per unit length was 2 times higher in the plaque region than in the non-plaque region of the same vessel (p = 3 × 10(-5)). Increased expression of matrix metalloproteinase 9 co-localized with glycocalyx shedding and plaque buildup.

Conclusions: Our results suggest that, in concert with endothelial apoptosis that increases lipid permeability, glycocalyx shedding initiated by inflammation facilitates monocyte adhesion and macrophage infiltration that promote lipid retention and the development of atherosclerotic plaques.

Keywords: Atherosclerosis; Endothelial cell apoptosis; Glycocalyx; Inflammation.


Figures

Fig. 1
Fig. 1. Dissection of vessels from normal diet fed wild type mouse and high fat fed ApoE−/− mouse
(A) Schematic showing flow direction (arrow) of blood, 1% BSA, or 2% paraformaldehyde from the heart/aortic root and through the proximal branches of the vascular tree. (B) Picture of dissected wild type mouse on a normal diet, with clear vessels. (C) Picture of dissected ApoE−/− mouse on a high fat diet, with plaque filled (white streaks) vessels. The dissected vessels of interest are denoted by numbers 1 and 2, where 1 is the descending aorta (DA) and 2 is the brachiocephalic artery (BCA). (D) Representative image of Oil Red O stained lipid-laden plaque from the BCA of a high fat diet fed ApoE−/− mouse. (E) BCA of the same mouse immunostained for PECAM (red) demonstrates that, although a large plaque is present, endothelial cell coverage on the inner vessel wall can be seen on both the non-plaque and plaque regions. The staining also shows increased intra-plaque neo-vascularization. DAPI (blue) labels cell nuclei.
Fig. 2
Fig. 2. Apoptosis in the BCA
Cross-sections shown in images A-D were stained for apoptosis using TUNEL. Cell nuclei are stained with DAPI (blue), elastin sheets auto-fluoresce in green, and apoptotic cells are labeled with FITC-TUNEL (bright green). (A) 20X image of the BCA obtained from a high fat fed ApoE−/− mouse, and (B) zoomed image of the boxed area in (A) showing elevated apoptosis. (C) 20X image of the BCA obtained from a normal diet fed wildtype mouse, and (D) zoomed image of the boxed area in (C) showing no sign of apoptosis. (E) TUNEL-positive ECs per cm in the in the wildtype vs. ApoE−/− (including plaque and non-plaque areas). N=86 sections from 6 animals for ApoE−/−, N=73 sections from 5 animals for wild type (data points represent the mean of each animal); *p<0.0001 by non-parametric Mann-Whitney test. (F) TUNEL-positive ECs per cm in plaque and non-plaque areas of the ApoE−/− BCA. N=86 sections; *p<0.0001 by paired t-test.
Fig. 3
Fig. 3. Apoptosis in DA
Cross-sections shown in images A-D were stained for apoptosis using TUNEL. Cell nuclei are stained with DAPI (blue), elastin sheets auto-fluoresce in green, and apoptotic cells are labeled with FITC-TUNEL (bright green). (A) 20X image of the DA obtained from a high fat fed ApoE−/− mouse, and (B) zoomed image of the boxed area in (A) showing elevated apoptosis. (C) 20X image of the DA obtained from a normal diet fed wild type mouse, and (D) zoomed image of the boxed area in (C) showing no sign of apoptosis. (E) TUNEL-positive ECs per cm in the wild type vs. ApoE−/−. N=97 sections from 6 animals for ApoE−/−, N=67 sections from 4 animals for wild type (data points represent the mean of each animal); *p<0.0001 by non-parametric Mann-Whitney test.
Fig. 4
Fig. 4. GCX coverage and thickness in BCA sections stained with HABP to label the HA GCX component
(A) 10X image of a BCA with plaque, obtained from a high fat fed ApoE−/− mouse. GCX can be seen overlying non-plaque tissue (arrow) and is degraded overlying the plaque (star). (B) 63X/oil image of degraded GCX over plaque. Star indicates location of degraded GCX; arrow points to remaining GCX. (C) 63X/oil image of intact GCX (arrow) over the non-plaque region of diseased vessel. (D) 10X image of a healthy BCA without plaque and with fully intact GCX (arrow), obtained from a normal diet fed wildtype mouse. (E) 63X/oil image of intact GCX (arrow) in healthy vessel. (F-I) GCX quantification taken from 6-7 mice per condition. Mean comparisons were performed using unpaired t-tests. *p < 0.05; **p < 0.01.
Fig. 5
Fig. 5. GCX coverage and thickness in DA sections stained with HABP to label the HA GCX component
(A) 10X image of a DA obtained from a high fat fed ApoE−/− mouse. The GCX coats the entire inner vessel wall (arrow). (B) 63X/oil image of intact GCX shown in A; arrow points to the GCX. (C) 10X image of GCX (arrow) on DA obtained from a normal diet fed wildtype mouse. (D) 63X/oil image of intact GCX (arrow) shown in C. (E, F) GCX quantification taken from 6-7 mice per condition. Mean comparisons were performed using unpaired t-tests.
Fig. 6
Fig. 6. MMP-9 staining in BCA sections
(A) Selection of the region of interest (ROI) for MMP-9 quantification in the endothelial layer. ROI was traced (yellow line) in the merged image (left panels) and quantified in the red channel (MMP-9; right panels). Typical selection areas are shown for the plaque (top panels) and non-plaque (bottom panels) areas of the ApoE−/− BCA. (B) 20X image of BCA with plaque, obtained from a high fat fed ApoE−/− mouse. MMP-9 staining (red) is seen throughout the plaque. (C) 63X/oil image of MMP-9 stain in the plaque. (D) 63X/oil image of MMP-9 stain in the non-plaque region of diseased vessel. (E) 20X image of a healthy BCA without plaque, obtained from a normal diet fed wildtype mouse, shows little MMP-9 staining. (F) 63X/oil image of MMP-9 stain in healthy vessel. (G) Quantification of MMP-9 intensity within the ROI as shown in (A). Mean comparisons were performed using 1-way ANOVA with Tukey’s method to correct for multiple comparisons. N=33 for BCA samples; N=71 for DA WT; N=54 for DA ApoE−/−. ****p<0.0001, *p<0.05. Scale bar = 50 μm for B and E; scale bar = 10 μm for C-D, F.

References

    1. Santos-Gallego CG, Picatoste B, Badimon JJ. Pathophysiology of acute coronary syndrome. Curr Atheroscler Rep. 2014;16(4):401. - PubMed
    1. Chiu JJ, Chien S. Effects of disturbed flow on vascular endothelium: pathophysiological basis and clinical perspectives. Physiol Rev. 2011;91(1):327–87. - PMC - PubMed
    1. Michel CC, Curry FE. Microvascular permeability. Physiol Rev. 1999;79(3):703–61. - PubMed
    1. Ogunrinade O, Kameya GT, Truskey GA. Effect of fluid shear stress on the permeability of the arterial endothelium. Ann Biomed Eng. 2002;30(4):430–46. - PubMed
    1. Tarbell JM. Mass transport in arteries and the localization of atherosclerosis. Annu Rev Biomed Eng. 2003;5:79–118. - PubMed

Publication types

MeSH terms