. 2016 Aug 17:6:31722.
doi: 10.1038/srep31722.

Immune tolerance to an intestine-adapted bacteria, Chryseobacterium sp., injected into the hemocoel of Protaetia brevitarsis seulensis

Affiliations

Immune tolerance to an intestine-adapted bacteria, Chryseobacterium sp., injected into the hemocoel of Protaetia brevitarsis seulensis

Jiae Lee et al. Sci Rep. .

Abstract

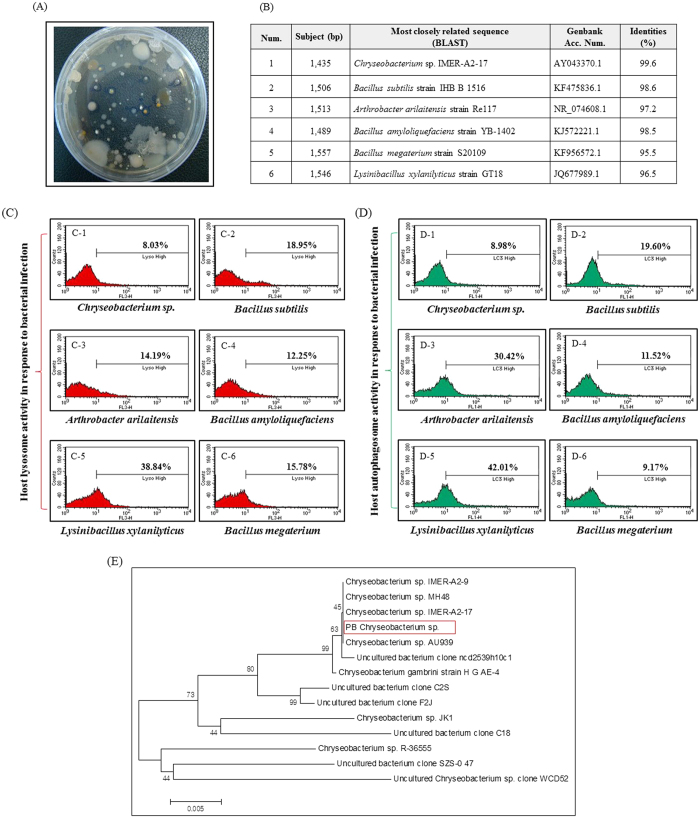
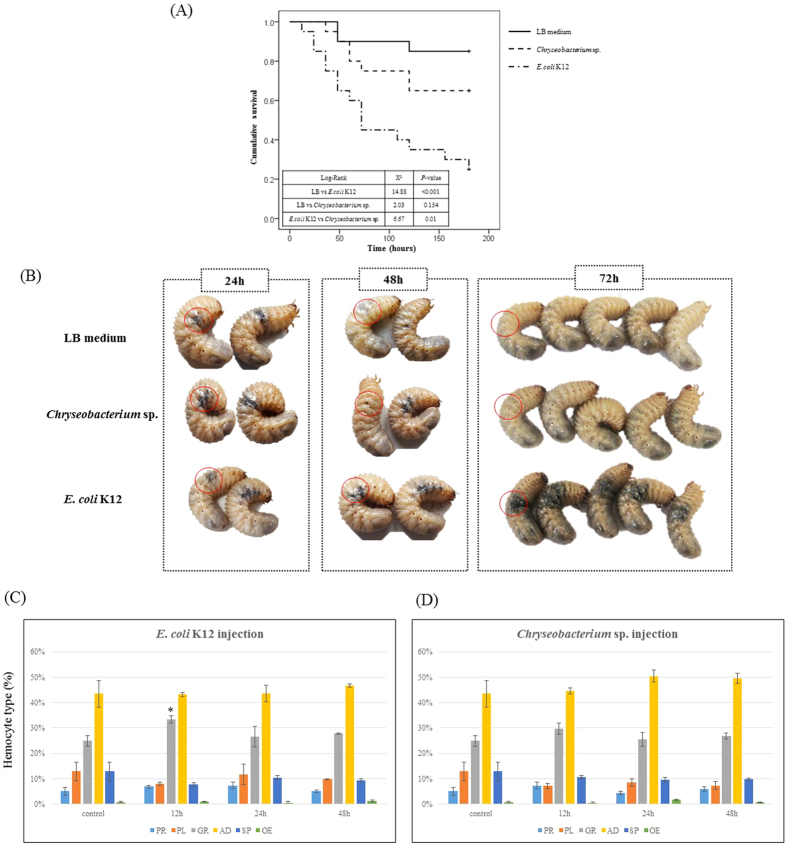
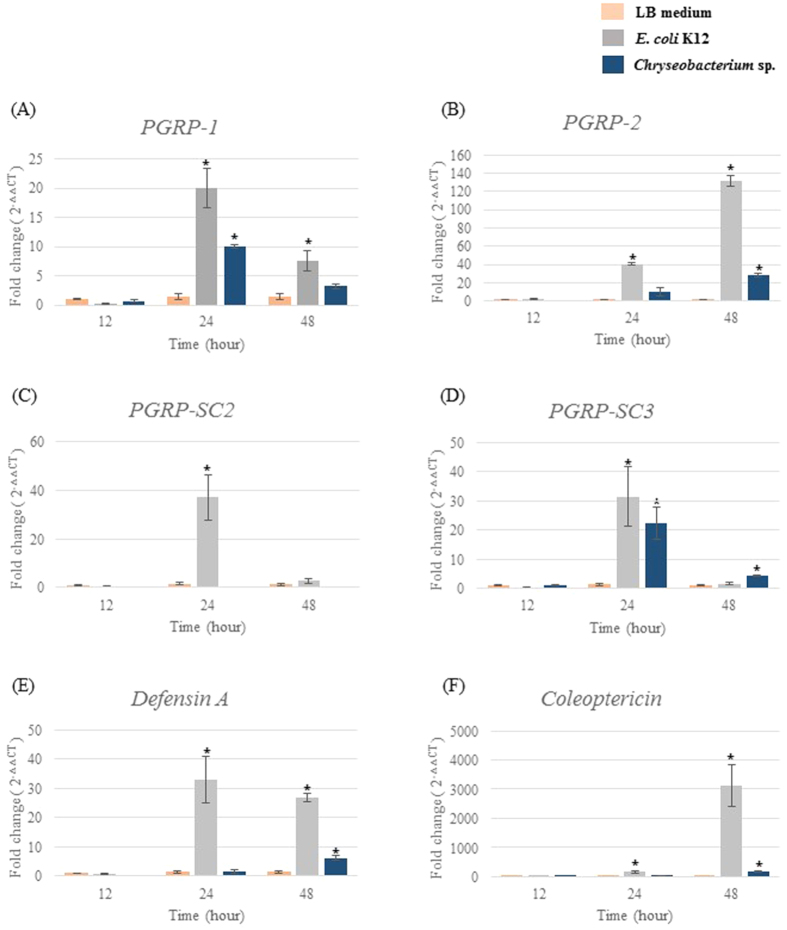
To explore the interaction of gut microbes and the host immune system, bacteria were isolated from the gut of Protaetia brevitarsis seulensis larvae. Chryseobacterium sp., Bacillus subtilis, Arthrobacter arilaitensis, Bacillus amyloliquefaciens, Bacillus megaterium, and Lysinibacillus xylanilyticus were cultured in vitro, identified, and injected in the hemocoel of P. brevitarsis seulensis larvae, respectively. There were no significant changes in phagocytosis-associated lysosomal formation or pathogen-related autophagosome in immune cells (granulocytes) from Chryseobacterium sp.-challenged larvae. Next, we examined changes in the transcription of innate immune genes such as peptidoglycan recognition proteins and antimicrobial peptides following infection with Chryseobacterium sp. PGRP-1 and -2 transcripts, which may be associated with melanization generated by prophenoloxidase (PPO), were either highly or moderately expressed at 24 h post-infection with Chryseobacterium sp. However, PGRP-SC2 transcripts, which code for bactericidal amidases, were expressed at low levels. With respect to antimicrobial peptides, only coleoptericin was moderately expressed in Chryseobacterium sp.-challenged larvae, suggesting maintenance of an optimum number of Chryseobacterium sp. All examined genes were expressed at significantly higher levels in larvae challenged with a pathogenic bacterium. Our data demonstrated that gut-inhabiting bacteria, the Chryseobacterium sp., induced a weaker immune response than other pathogenic bacteria, E. coli K12.


Figures

Figure 1
Figure 1. Identification and phylogenetic analysis of Chryseobacterium sp. and the host immune responses to the six isolated gut bacteria.
(A) Bacteria isolated from the gut of Protaetia brevitarsis seulensis were cultured on agar plates. Bacterial colonies exhibited different morphologies and growth rates. (B) Six bacterial colonies were randomly chosen and the bacterial small subunit ribosomal RNA (16S rRNA) gene was fully sequenced. A BLAST search of the GenBank database revealed that the 16S rRNA gene from all six colonies was >95% identical. The round, yellowish colony was identified as Chryseobacterium sp. (C) Flow cytometry analysis of LysoTracker Red staining at 12 h post-infection. (D) Flow cytometry analysis of green fluroscent-LC3 staining at 12 h post-infection. A low percentage of hemocytes from larvae injected with Chryseobacterium sp. were stained with LysoTracker Red (8.03% indicated by red color) and green fluorescent LC3 (8.98% indicated by green color). C-1 and D-1: injection with Chryseobacterium sp. (KX371567). C-2 and D-2: injection with Bacillus subtilis (KX369580). C-3 and D-3: injection with Arthrobacter arilaitensis (KX369581). C-4 and D-4: injection with Bacillus amyloliquefaciens (KX369577). C-5 and D-5: injection with Lysinibacillus xylanilyticus (KX371346). C-6 and D-6: injection with Bacillus megaterium (KX369578). (E) The phylogenetic tree showed that Chryseobacterium sp. (highlighted in a red box) was closely related to Chryseobacterium sp. IMER-A2-17. Species are referenced by strain number and GenBank accession number. Tree building was performed using the neighbor-joining method and fastDNAml. Scale Bar, 0.005 substitutions per base position.
Figure 2
Figure 2. Larval survival and changes in hemocyte number in response to infection by E. coli K12 or Chryseobacterium sp.
(A) Kaplan-Meier survival curve with log-rank test comparing survival of Protaetia brevitarsis seulensis larva infected with LB medium, Chryseobacterium sp., or E. coli K12. A p-value of less than 0.05 was considered statistically significant. Pairwise comparison: LB medium vs. E. coli K12, p < 0.001; LB medium vs. Chryseobacterium sp., p = 0.154; Chryseobacterium sp. vs. E. coli K12, p = 0.01. (B) Melanization in response to LB medium, Chryseobacterium sp., or E. coli K12 at 24 h, 48 h, or 72 h post-infection. The dark melanized spots gradually and completely disappeared at around 72 h post-infection with Chryseobacterium sp. or LB medium, but persisted in larvae infected with E. coli K12. Melanization within the injected area (marked by a red circle) was evident in E. coli K12-challenged larvae, but not in Chryseobacterium sp.- or LB medium-challenged larvae. (C,D) Five larvae per group were infected with Chryseobacterium sp. or E. coli K12 and the percentage of each of six circulating hemocyte types were assessed at different time points (12 h, 24 h, or 48 h). PR, prohemocytes; PL, plasmatocytes; GR, granulocytes; SP, spherulocytes; OE, oenocytoids; and AD, adipohemocytes. Results are expressed as the mean and standard deviation. (*P < 0.05). Challenged larvae were infected with E. coli K12 (C) or Chryseobacterium sp. (D).
Figure 3
Figure 3. LysoTracker Red labeling of lysosomes in granulocytes and flow cytometric analysis after infection with E. coli K12 or Chryseobacterium sp.
(A) Development of lysosomes after infection. Confocal fluorescent microscope images of granulocytes stained with LysoTracker Red (a lysosomal marker). E. coli K12 infection: (A-1) 0 h post-infection; (A-2, A-3) 12 h post-infection; (A-4) 48 h post-infection. Chryseobacterium sp. infection: (A-5) 0 h post-infection; (A-6 and A-7) 12 h post-infection; (A-8) 48 h post-infection. A-1-1, A-2-1, A-3-1, A-4-1, A-5-1, A-6-1, A-7-1, and A-8-1 are higher magnification images of the regions shown in the insets in panels A-1 through to A-8. GR, granulocytes; PL, plasmatocytes. Scale bar = 20 μm. At 12 h post-infection with E. coli K12, over 90% of granulocytes were strongly stained by LysoTracker Red (red in A-2 and A-3); however, staining was very faint after infection by Chryseobacterium sp. (A-6 and A-7). (B,C) Flow cytometry analysis of the total hemocyte population at 0~48 h post-infection with E. coli K12 or Chryseobacterium sp. At 12 h post-infection with E. coli K12, the percentage of stained granulocytes in the Lysohigh region increased from 10.36% to 32.31%. This gradually fell to 11.08% at 48 h post-infection. However, there was no increase in the population of stained granulocytes from Chryseobacterium sp.-challenged larvae (10.07% at 0 h, 11.02% at 12 h, and etc.). (D) Low levels of pathogen-associated lysosome activity were always observed in LB medium-challenged larvae (<5%). (E) Student’s t-test analysis of flow cytometry results to compare differences between E. coli K12- and Chryseobacterium sp.-challenged group. The experiment was repeated for three times. Error bars indicate Mean±SEM. *P < 0.05 (t-test). NS, not significant.
Figure 4
Figure 4. Green fluorescent-LC3 staining in granulocytes and flow cytometric analysis after infection with E. coli K12 or Chryseobacterium sp.
(A) Formation of pathogen-related autophagosomes. Confocal fluorescent microscope images of granulocytes stained with DAPI (nuclei) and green fluorescent LC3 (autophagosomes). E. coli K12 infection: (A-1) 0 h post-infection; (A-2 and A-3) 24 h post-infection; (A-4 and A-5) 48 h post-infection. Chryseobacterium sp. infection: (A-6) 0 h post-infection; (A-7 and A-8) 24 h post-infection; (A-9 and A-10) 48 h post-infection. A-1-1 through to A-10-1 show the insets in panels A-1 through to A-10 at higher magnification. GR, granulocytes; PL, plasmatocytes. Scale bar = 20 μm. Many granulocytes were strongly stained by green fluorescent LC3 at 24 h post-E. coli K12 infection (A-2 and A-3), but staining was very faint in granulocytes after Chryseobacterium sp. infection (A-7 and A-8). (B,C) Total hemocytes at 0 ~48 h post-infection with E. coli K12 or Chryseobacterium sp. At 24 h post-infection with E. coli K12, the percentage of stained hemocytes in the LC3high region increased from 6.88% to 27.90%, before falling again to 8.40% at 48 h post-infection. However, there were no observable changes in green fluorescence intensity in hemocytes from Chryseobacterium sp.-challenged larvae (7.11% at 0 h and 4.50% at 24 h). (D) Low levels of pathogen-associated autophagosome activity were always observed in LB medium-challenged larvae (<7%). (E) Student’s t-test of flow cytometry results to compare differences between E. coli K12- and Chryseobacterium sp.-challenged group. The experiment was repeated for three times. Error bars indicate Mean±SEM. *P < 0.05 (t-test). NS, not significant.
Figure 5
Figure 5. Expression of host immune genes at different time points after infection with E. coli K12 or Chryseobacterium sp.
Expression of six immune-related genes [four peptidoglycan recognition proteins (A) PGRP-1; (B) PGRP-2; C, PGRP-SC2; and (D) PGRP-SC3) and two antimicrobial peptides (E) defensin A and (F) coleoptericin)] in fatbodies from LB-medium, E. coli K12, or Chryseobacterium sp.-challenged larvae. Expression was normalized to that in LB medium-challenged larvae. Values are expressed as the mean of three replicates ± SEM, each containing three larvae (nine larvae per condition). *P < 0.05 (t-test).

References

    1. Tsuzuki S. et al. Switching between humoral and cellular immune responses in Drosophila is guided by the cytokine GBP. Nat. Commun. 5, 4628, doi: 10.1038/ncomms5628 (2014). - DOI - PMC - PubMed
    1. Marmaras V. J. & Lampropoulou M. Regulators and signalling in insect haemocyte immunity. Cell. Signal. 21, 186–195, doi: 10.1016/j.cellsig.2008.08.014 (2009). - DOI - PubMed
    1. Castillo J., Robertson A. & Strand M. Characterization of hemocytes from the mosquitoes Anopheles gambiae and Aedes aegypti. Insect Biochem. Mol. Biol. 36, 891–903, doi: 10.1016/j.ibmb.2006.08.010 (2006). - DOI - PMC - PubMed
    1. Kwon H., Bang K. & Cho S. Characterization of the hemocytes in larvae of Protaetia brevitarsis seulensis: involvement of granulocyte-mediated phagocytosis. Plos One 9, e103620, doi: 10.1371/journal.pone.0103620 (2014). - DOI - PMC - PubMed
    1. Williams M. J. Drosophila hemopoiesis and cellular immunity. J. Immunol. 178, 4711–4716, doi: 10.1111/j.1600-065X.2010.00922.x (2007). - DOI - PubMed

Publication types

MeSH terms

LinkOut - more resources