

Resolving microbial membership using Abundance and Variability In Taxonomy ('AVIT )
- PMID: 27530237
- PMCID: PMC4987704
- DOI: 10.1038/srep31655
Resolving microbial membership using Abundance and Variability In Taxonomy ('AVIT )
Abstract
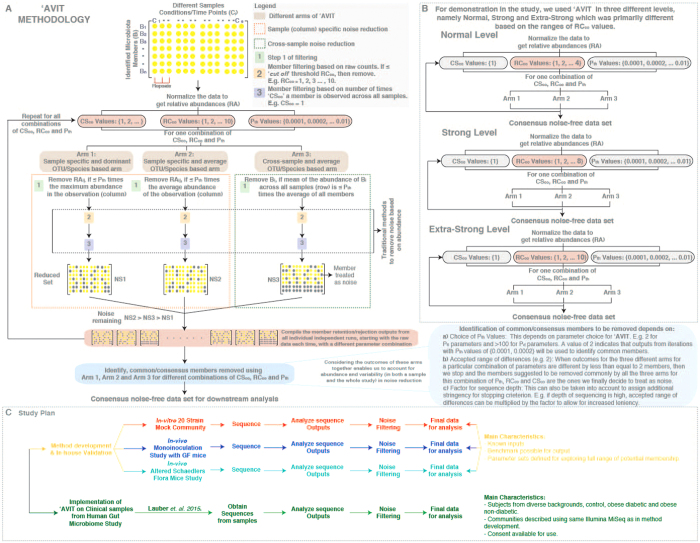
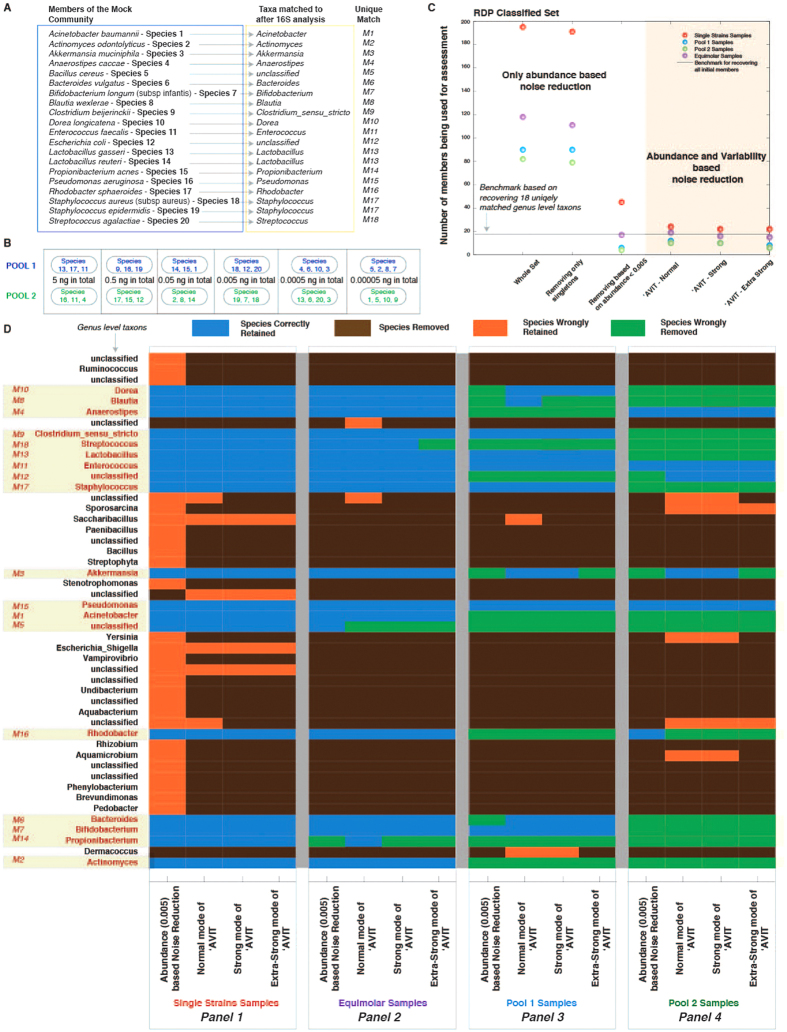
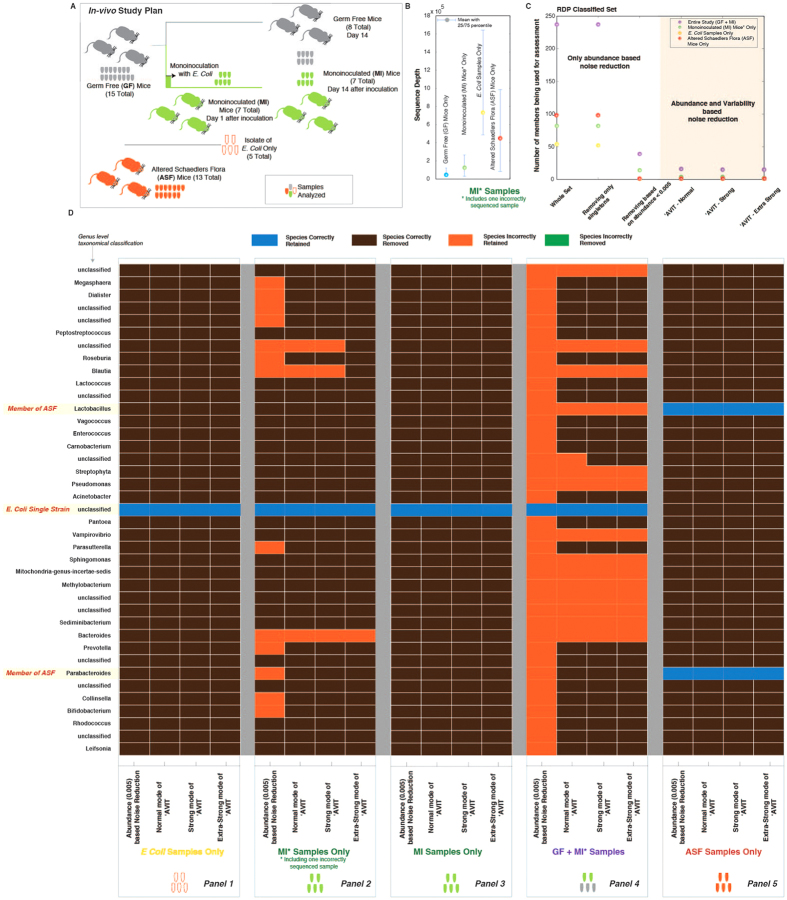
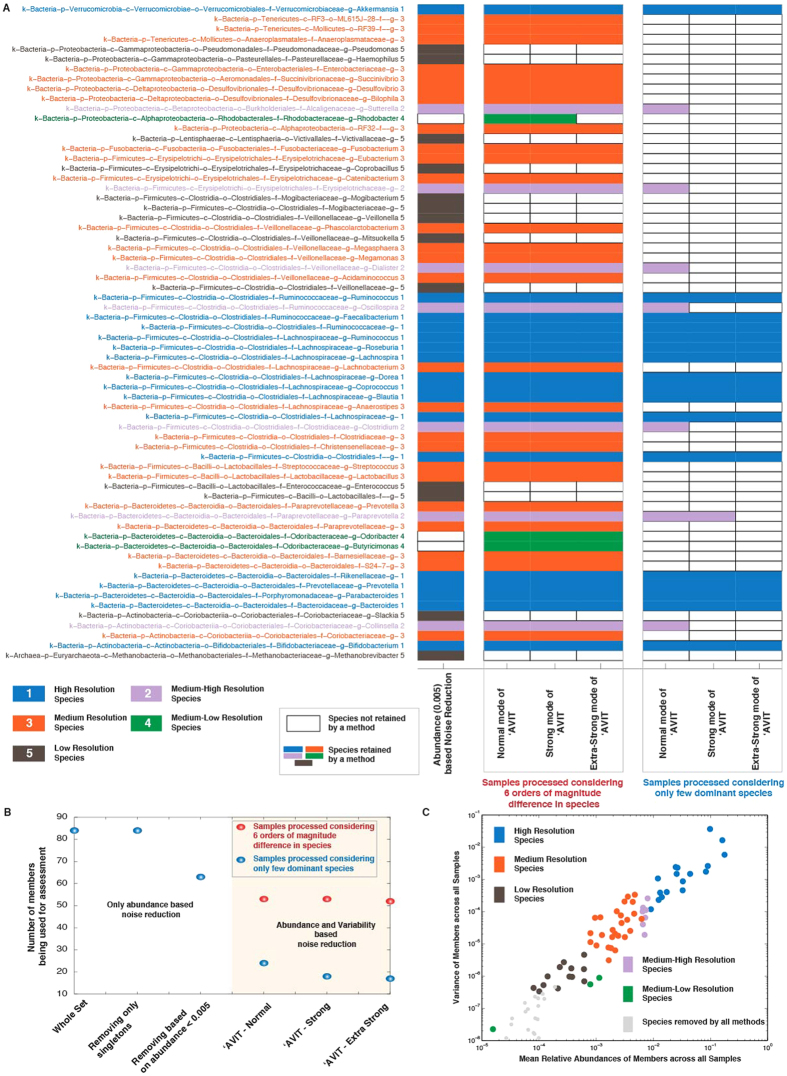
Development of NGS has revolutionized the analysis in microbial ecology contributing to our deeper understanding of microbiota in health and disease. However, the quality, quantity and confidence of summarized taxonomic abundances are in need of further scrutiny due to sample dependent and independent effects. In this article we introduce 'AVIT (Abundance and Variability In Taxonomy), an unbiased method to enrich for assigned members of microbial communities. As opposed to using a priori thresholds, 'AVIT uses inherent abundance and variability of taxa in a dataset to determine the inclusion or rejection of each taxa for further downstream analysis. Using in-vitro and in-vivo studies, we benchmarked performance and parameterized 'AVIT to establish a framework for investigating the dynamic range of microbial community membership in clinically relevant scenarios.
Conflict of interest statement
A.C., J.S., C.L.L., C.J.C., M.M., B.B., C.L., S.J.P. are employees of Nestle SA.
Figures
Similar articles
-
PhyloCore: A phylogenetic approach to identifying core taxa in microbial communities.Gene. 2016 Nov 30;593(2):330-3. doi: 10.1016/j.gene.2016.08.032. Epub 2016 Aug 24. Gene. 2016. PMID: 27567683 Free PMC article.
-
A real-time PCR assay for accurate quantification of the individual members of the Altered Schaedler Flora microbiota in gnotobiotic mice.J Microbiol Methods. 2017 Apr;135:52-62. doi: 10.1016/j.mimet.2017.02.003. Epub 2017 Feb 9. J Microbiol Methods. 2017. PMID: 28189782 Free PMC article.
-
Microbial ecosystems are dominated by specialist taxa.Ecol Lett. 2015 Sep;18(9):974-82. doi: 10.1111/ele.12478. Epub 2015 Aug 6. Ecol Lett. 2015. PMID: 26251267
-
Colonization resistance and microbial ecophysiology: using gnotobiotic mouse models and single-cell technology to explore the intestinal jungle.FEMS Microbiol Rev. 2013 Sep;37(5):793-829. doi: 10.1111/1574-6976.12024. Epub 2013 Jun 5. FEMS Microbiol Rev. 2013. PMID: 23662775 Review.
-
Metagenomic studies of the Red Sea.Gene. 2016 Feb 1;576(2 Pt 1):717-23. doi: 10.1016/j.gene.2015.10.034. Epub 2015 Oct 23. Gene. 2016. PMID: 26526132 Review.
Cited by
-
Transcriptomics-driven lipidomics (TDL) identifies the microbiome-regulated targets of ileal lipid metabolism.NPJ Syst Biol Appl. 2017 Nov 7;3:33. doi: 10.1038/s41540-017-0033-0. eCollection 2017. NPJ Syst Biol Appl. 2017. PMID: 29138692 Free PMC article.
-
Eating eggplants as a cucurbit feeder: Dietary shifts affect the gut microbiome of the melon fly Zeugodacus cucurbitae (Diptera, Tephritidae).Microbiologyopen. 2022 Aug;11(4):e1307. doi: 10.1002/mbo3.1307. Microbiologyopen. 2022. PMID: 36031958 Free PMC article.
References
-
- Gilbert J. A. et al. The seasonal structure of microbial communities in the Western English Channel.Environ Microbiol 11, 3132–3139 (2009). - PubMed
-
- Khashan A. S. et al. Mode of obstetrical delivery and type 1 diabetes: a sibling design study. Pediatrics 134, e806–13 (2014). - PubMed
-
- Petrova M. I., van den Broek M., Balzarini J., Vanderleyden J. & Lebeer S. Vaginal microbiota and its role in HIV transmission and infection. FEMS Microbiology Reviews 37, 762–792 (2013). - PubMed
-
- Murgas Torrazza R. & Neu J. The developing intestinal microbiome and its relationship to health and disease in the neonate. J Perinatol 31 Suppl 1, S29–34 (2011). - PubMed
MeSH terms
LinkOut - more resources
Full Text Sources
Other Literature Sources
Molecular Biology Databases
Research Materials
