. 2016 Oct 15;76(20):6118-6129.
doi: 10.1158/0008-5472.CAN-16-1272. Epub 2016 Aug 16.

CRISPR/Cas9-Mediated Trp53 and Brca2 Knockout to Generate Improved Murine Models of Ovarian High-Grade Serous Carcinoma

Affiliations

CRISPR/Cas9-Mediated Trp53 and Brca2 Knockout to Generate Improved Murine Models of Ovarian High-Grade Serous Carcinoma

Josephine Walton et al. Cancer Res. .

Abstract

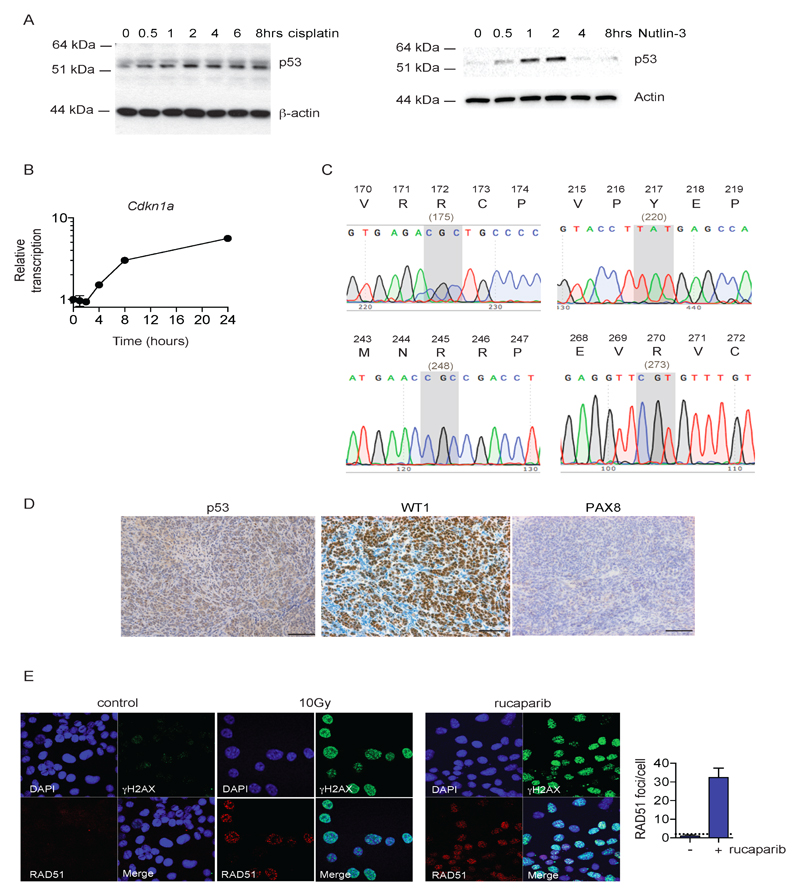
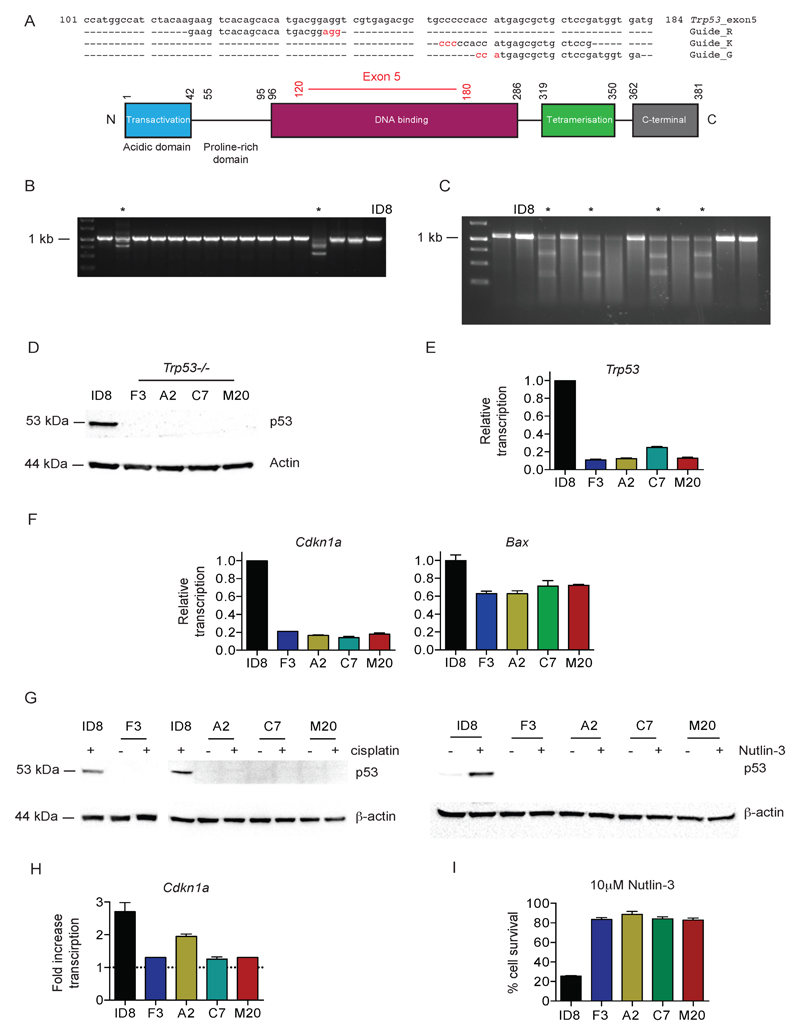
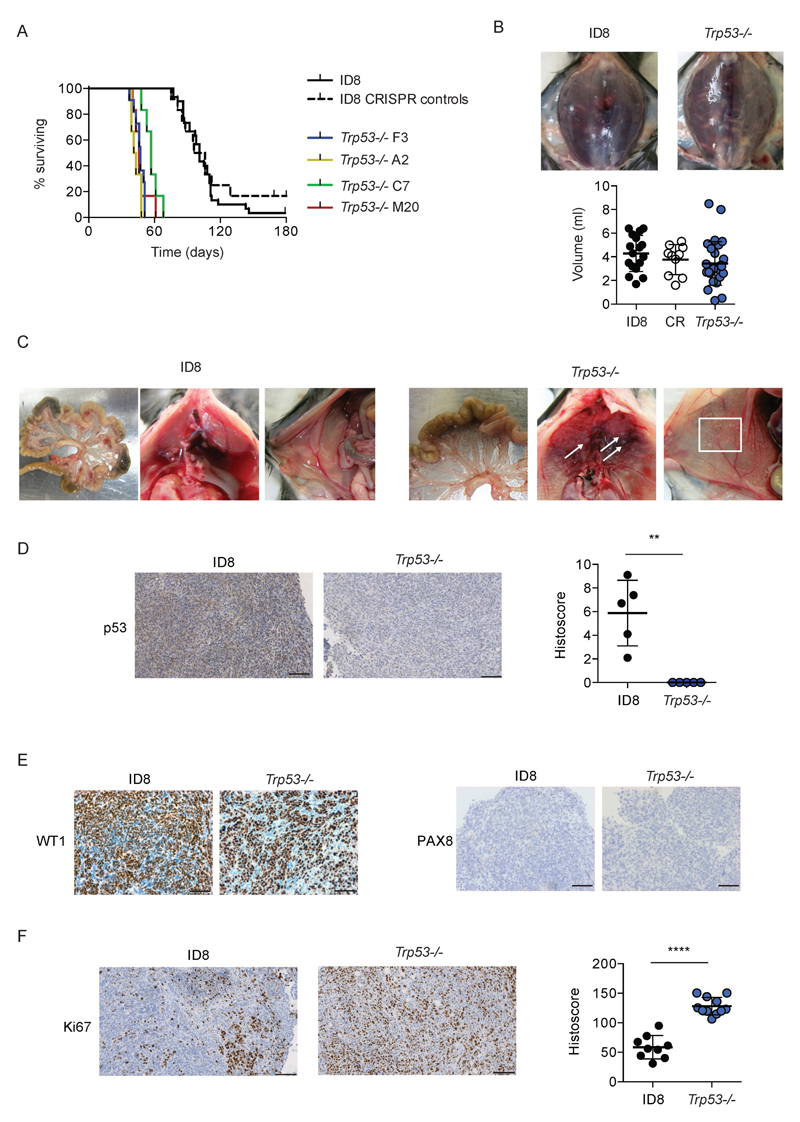
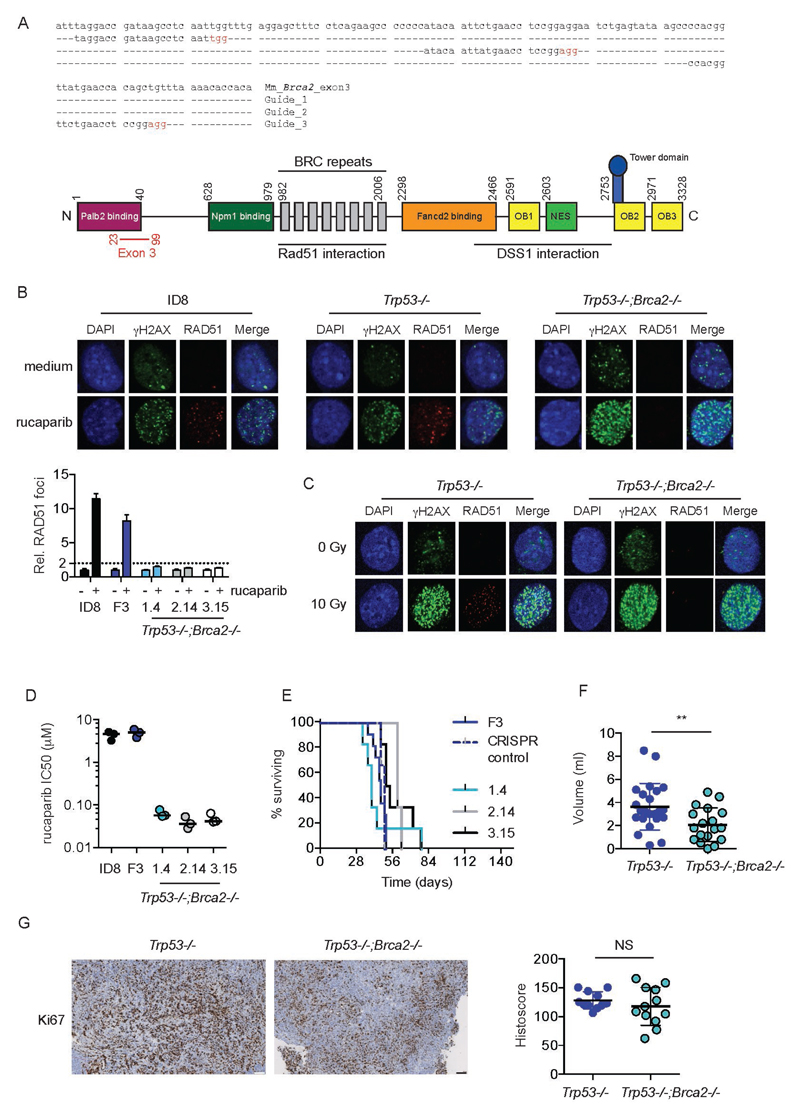
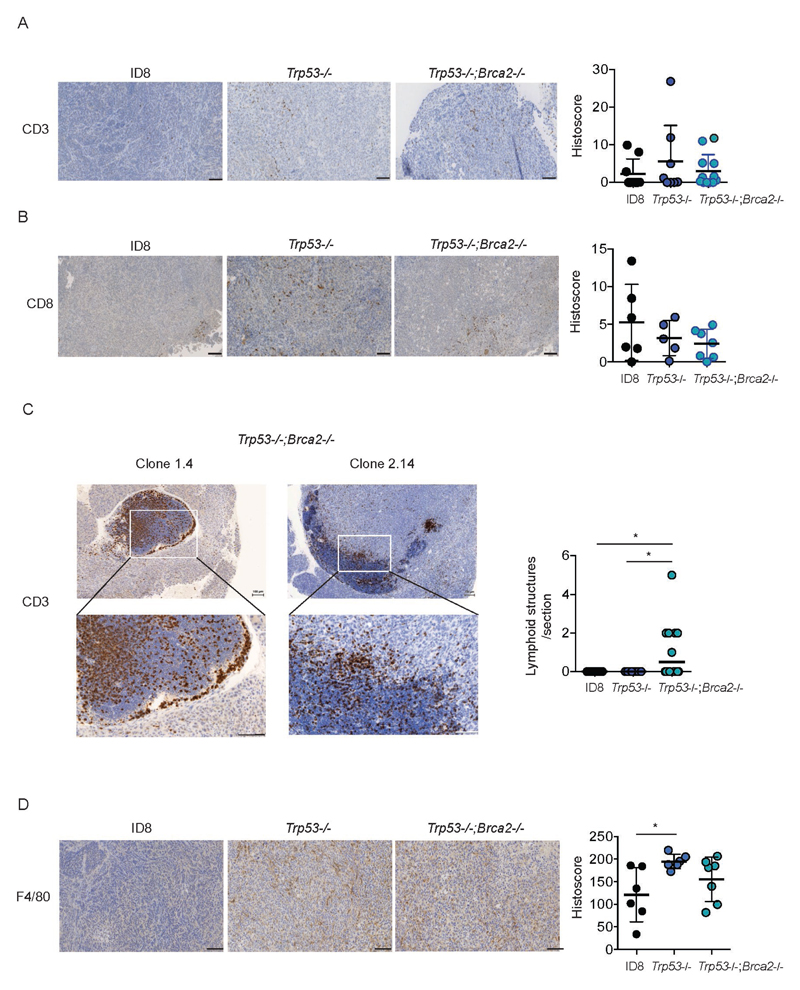
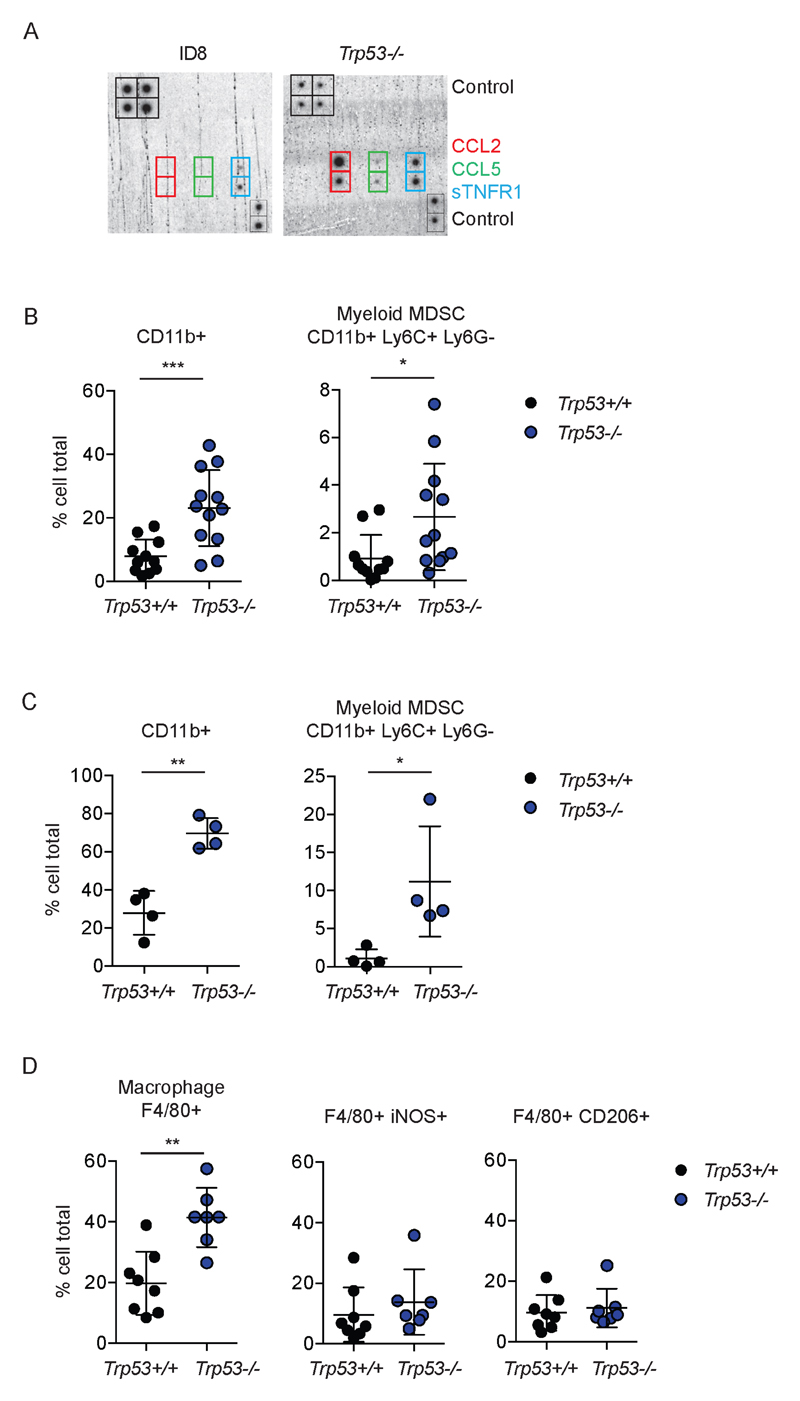
There is a need for transplantable murine models of ovarian high-grade serous carcinoma (HGSC) with regard to mutations in the human disease to assist investigations of the relationships between tumor genotype, chemotherapy response, and immune microenvironment. In addressing this need, we performed whole-exome sequencing of ID8, the most widely used transplantable model of ovarian cancer, covering 194,000 exomes at a mean depth of 400× with 90% exons sequenced >50×. We found no functional mutations in genes characteristic of HGSC (Trp53, Brca1, Brca2, Nf1, and Rb1), and p53 remained transcriptionally active. Homologous recombination in ID8 remained intact in functional assays. Further, we found no mutations typical of clear cell carcinoma (Arid1a, Pik3ca), low-grade serous carcinoma (Braf), endometrioid (Ctnnb1), or mucinous (Kras) carcinomas. Using CRISPR/Cas9 gene editing, we modeled HGSC by generating novel ID8 derivatives that harbored single (Trp53-/-) or double (Trp53-/-;Brca2-/-) suppressor gene deletions. In these mutants, loss of p53 alone was sufficient to increase the growth rate of orthotopic tumors with significant effects observed on the immune microenvironment. Specifically, p53 loss increased expression of the myeloid attractant CCL2 and promoted the infiltration of immunosuppressive myeloid cell populations into primary tumors and their ascites. In Trp53-/-;Brca2-/- mutant cells, we documented a relative increase in sensitivity to the PARP inhibitor rucaparib and slower orthotopic tumor growth compared with Trp53-/- cells, with an appearance of intratumoral tertiary lymphoid structures rich in CD3+ T cells. This work validates new CRISPR-generated models of HGSC to investigate its biology and promote mechanism-based therapeutics discovery. Cancer Res; 76(20); 6118-29. ©2016 AACR.


Conflict of interest statement

Conflict of interest: The authors have no conflicts of interest to declare

Figures

Figure 1
Figure 1. ID8 retains wild-type p53 function and demonstrates competent homologous recombination
A. Expression of p53 was assessed in ID8 cells following treatment for up to 8 hours with 10 µM cisplatin (left) or 10 µM Nutlin-3 (right) B. Transcription of p53 target Cdkn1a in ID8 cells following treatment for up to 8 hours with 10 µM cisplatin was assessed by quantitative reverse-transcriptase PCR, normalised to Rpl34. Data represent mean +/- s.d. (n=3) plotted relative to untreated cells (t = 0 hrs). C. Representative chromatograms of Sanger sequencing of p53 from parental ID8 tumors harvested after 110 days intraperitoneal growth in female C57Bl/6 mice, demonstrating no mutations at critical hotspot mutations sites at residues 172, 217, 245 and 270 – the equivalent human codons are shown in parentheses below. D. ID8 tumors, fixed in 4% neutral-buffered formalin, were stained for p53, WT1 and PAX8. Bars represent 100 µm. E. ID8 cells were irradiated (10Gy) or treated with rucaparib (10µM for 24h), fixed and stained for γH2AX and RAD51, and counterstained with DAPI. RAD51 foci were counted in up to 30 untreated and rucaparib-treated cells. Bars represented mean (+/- s.d.) RAD51 foci per cell; dotted line represents two-fold increase in RAD51 foci/cell relative to untreated cells, suggestive of functional homologous recombination (21).
Figure 2
Figure 2. Generation and evaluation of Trp53-/- ID8 cells using CRISPR/Cas9.
A. Design of three gRNA sequences, targeted to exon 5 of Trp53 (upper). Nucleotides in red represent PAM sequences. Schematic representation of p53 protein (lower). Numbers represent amino acid positions. Amino acids encoded by exon 5 are marked in red. B. Representative PCR of 1kb region spanning Trp53 exon 5 from genomic DNA extracted from ID8 and 15 single cell clones transfected with PX459 expressing gRNA K. Clones with demonstrable deletions are marked *. C. Representative Surveyor Nuclease Assay, performed on ID8 and 11 single cell clones transfected with PX459 expressing Trp53 gRNA K as described in Material and Methods. Clones with mismatch suggestive of nucleotide deletion are marked *. D. Expression of p53 was assessed in parental ID8 and four Trp53-/- clones by immunoblot E. Transcription of Trp53 was assessed in parental ID8 and four Trp53-/- clones by quantitative reverse-transcriptase PCR, normalised to Rpl34. Bars represent mean +/- s.d. (n=3) plotted relative to parental ID8. F. Transcription of p53 target genes Cdkn1a and Bax was assessed in parental ID8 and Trp53-/- clones by quantitative reverse-transcriptase PCR, normalised to Rpl34. Bars represent mean +/- s.d. (n=3) plotted relative to parental ID8. G. Expression of p53 in ID8 and Trp53-/- clones before and after cisplatin (10 µM, 8 hours – left) and Nutlin-3 (10 µM, 2 hours – right). H. Fold-increase in Cdkn1a transcription in ID8 and Trp53-/- clones following cisplatin treatment (10 µM, 8 hours). Bars represent mean +/- s.d. (n=3), and dotted line represents baseline transcription in each cell population. I. ID8 and Trp53-/- clones were treated with 10 µM Nutlin-3, and cell survival assessed by MTT after 72 hours. Bars represent cell survival (mean +/- s.d., n=3) relative to untreated cells.
Figure 3
Figure 3. Loss of p53 increases rate of intraperitoneal growth of ID8 tumors.
5x10⁶ cells were injected intraperitoneally into female C57Bl/6 mice in groups of 6. Mice were killed when they reached humane endpoints. Ascites was taken from all mice and measured. Each point on histoscore plot represents mean score for multiple deposits (median 5, range 1 – 17) per animal normalised to tumor area. A. Loss of p53 significantly increases rate of intraperitoneal growth (p<0.0001 for all Trp53-/- clones compared to both parental ID8 and CRISPR control cells). Data from four ID8 parental groups (total n=24) and two groups each of CRISPR control and Trp53-/- F3 (total n = 12) are plotted. B. Loss of p53 does not alter volume of ascites at humane endpoint. C. Loss of p53 increases number of tumor deposits on peritoneal (white box) and sub-diaphragmatic (arrows) surfaces. Representative images from at least mice per genotype. D. Loss of p53 expression was confirmed by quantitative IHC in Trp53-/- tumors. **;p<0.01 E. No change in WT1 and PAX8 expression following p53 loss. F. Loss of p53 expression significantly increases intraperitoneal tumor proliferation, as measured by Ki67 staining. ****;p<0.0001.
Figure 4
Figure 4. Generation and evaluation of Trp53-/-;Brca2-/- ID8 cells using CRISPR/Cas9.
A. Design of three gRNA sequences, targeted to exon 3 of Brca2 (upper). Nucleotides in red represent PAM sequences. Schematic representation of Brca2 protein (lower). Numbers represent amino acid positions. OB – oligonucleotide binding domain; NES – nuclear export signal. Amino acids encoded by exon 3 are marked in red. B. Parental ID8, Trp53-/- cell line F3 and three Trp53-/-;Brca2-/- cells were treated with rucaparib (10µM), fixed and stained for γH2AX and RAD51, and counterstained with DAPI. Representative confocal microscopy images are presented (upper panels). RAD51 foci were counted in up to 30 untreated and rucaparib-treated cells. Bars represented mean (+/- s.d.) foci per cell relative to untreated cell; dotted line represents two-fold increase in foci/cell relative to untreated cells. C. Trp53-/- cell line F3 andTrp53-/-;Brca2-/- 3.15 cells were irradiated (10Gy), fixed and stained for γH2AX and RAD51, and counterstained with DAPI. D. Trp53-/-;Brca2-/- cells are significantly more sensitive to PARP inhibitor-induced cytotoxicity than either parental ID8 or Trp53-/- cell line F3. Each dot represents IC50 value from a single experiment performed in triplicate. Bars represent median IC50 for three separate experiments. E. 5x10⁶ cells were injected intraperitoneally into female C57Bl/6 mice in groups of 6. Mice were killed when they reached humane endpoints. Ascites was taken from all mice and measured. F3 CRISPR control cells are Trp53-/- F3 cells exposed to PX459 encoding Brca2 gRNA (Guide 1), but which contain no deletion in Brca2 on sequencing. F. Loss of Brca2 and p53 reduces volume of ascites compared to loss of p53 alone. **;p<0.01. G. Additional loss of Brca2 expression does not significantly alter intraperitoneal tumor proliferation, as measured by Ki67 staining. Bars on IHC images represent 100 µm. Each dot represents mean histoscore for multiple deposits (median 5, range 1 – 17) per animal, normalised to tumor area.
Figure 5
Figure 5. Loss of p53 and Brca2 expression alters immune cell infiltration in ID8 tumors
Formalin-fixed, paraffin-embedded tumors from all three genotypes (parental ID8, Trp53-/- and Trp53-/-;Brca2-/-) were stained for CD3 (A) and CD8 (B). The number of intra-epithelial lymphoid aggregates, defined as an area >0.1mm2, was counted in tumors from all three genotypes (C). No aggregates were identified in ID8 and Trp53-/- tumors. Bar represents median. *:p<0.05. Tumors were also stained for F4/80 (D). All bars represent 100 µm. Intensity of expression was quantified as detailed in Materials and Methods. Each dot represents mean histoscore for multiple deposits per animal, normalised to tumor area. *;p<0.05.
Figure 6
Figure 6. Loss of p53 expression increases CCL2 expression and induces immunosuppressive myeloid cell infiltration in tumor and ascites
A. Expression of chemokines in conditioned medium was assessed using immunoblot array. See Fig. S9 for complete array layout. B, C and D. Disaggregated whole tumor deposits (B) and ascites cells (C, D) were assessed by flow cytometry for CD4, CD8, CD11b, Ly6G, Ly6C, F4/80, CD206 and iNOS. Each dot represents a single tumor deposit (minimum three deposits/mouse) or ascites sample. Bars represent mean +/- s.d. Trp53+/+ populations include ID8 parental and CRISPR control cells lacking any Trp53 mutation. ***;p<0.001, **;p<0.01, *;p<0.05.

References

    1. Perren TJ, Swart AM, Pfisterer J, Ledermann JA, Pujade-Lauraine E, Kristensen G, et al. A phase 3 trial of bevacizumab in ovarian cancer. N Engl J Med. 2011;365(26):2484–96. - PubMed
    1. Bowtell DD, Bohm S, Ahmed AA, Aspuria PJ, Bast RC, Jr, Beral V, et al. Rethinking ovarian cancer II: reducing mortality from high-grade serous ovarian cancer. Nat Rev Cancer. 2015;15(11):668–79. - PMC - PubMed
    1. Ahmed AA, Etemadmoghadam D, Temple J, Lynch AG, Riad M, Sharma R, et al. Driver mutations in TP53 are ubiquitous in high grade serous carcinoma of the ovary. J Pathol. 2010;221(1):49–56. - PMC - PubMed
    1. TCGA. Integrated genomic analyses of ovarian carcinoma. Nature. 2011;474(7353):609–15. - PMC - PubMed
    1. Zhang S, Royer R, Li S, McLaughlin JR, Rosen B, Risch HA, et al. Frequencies of BRCA1 and BRCA2 mutations among 1,342 unselected patients with invasive ovarian cancer. Gynecol Oncol. 2011;121(2):353–57. - PubMed

Publication types

MeSH terms

Substances