

Comparative assessment of clinical response in patients with rheumatoid arthritis between PF-05280586, a proposed rituximab biosimilar, and rituximab
- PMID: 27530379
- PMCID: PMC5099556
- DOI: 10.1111/bcp.13094
Comparative assessment of clinical response in patients with rheumatoid arthritis between PF-05280586, a proposed rituximab biosimilar, and rituximab
Abstract
Aims: To evaluate potential differences between PF-05280586 and rituximab sourced from the European Union (rituximab-EU) and USA (rituximab-US) in clinical response (Disease Activity Score in 28 Joints [DAS28] and American College of Rheumatology [ACR] criteria), as part of the overall biosimilarity assessment of PF-05280586.
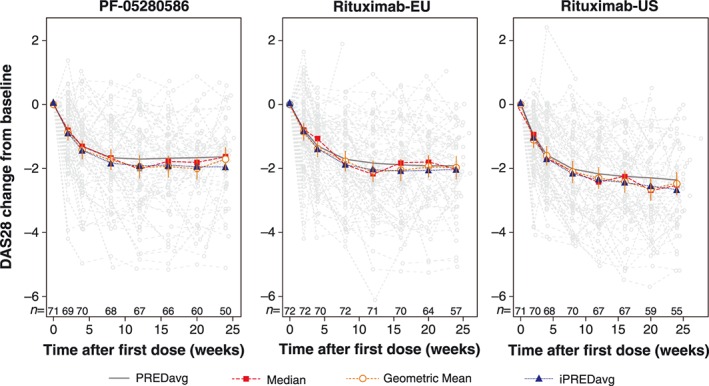
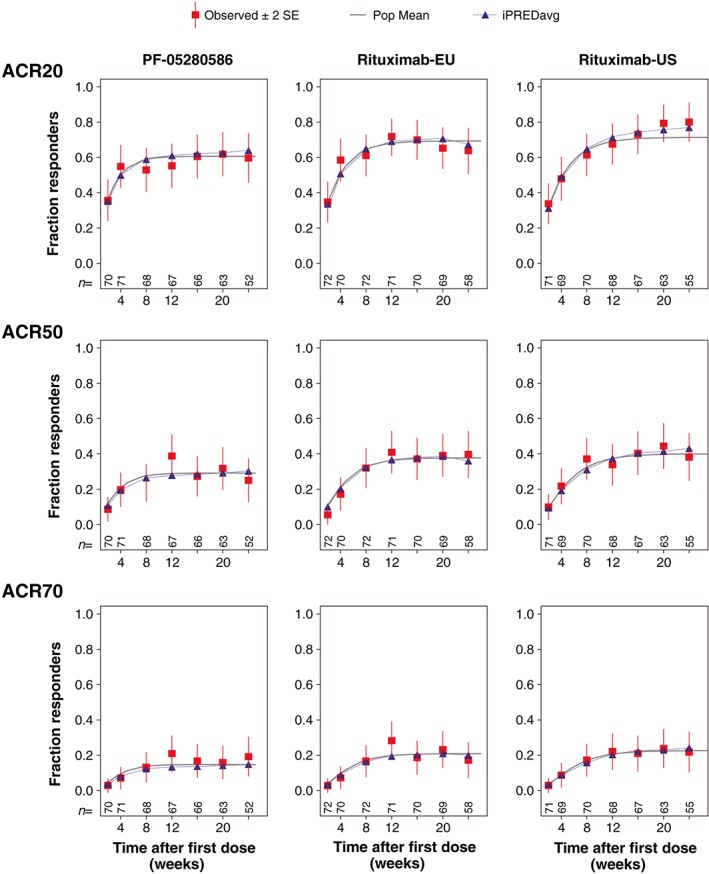
Methods: A randomised, double-blind, pharmacokinetic similarity trial was conducted in patients with active rheumatoid arthritis refractory to anti-tumour necrosis factor therapy on a background of methotrexate. Patients were treated with 1000 mg of PF-05280586, rituximab-EU or rituximab-US on days 1 and 15 and followed over 24 weeks for pharmacokinetic, clinical response and safety assessments. Key secondary end points were the areas under effect curves for DAS28 and ACR responses. Mean differences in areas under effect curves were compared against respective reference ranges established by observed rituximab-EU and rituximab-US responses using longitudinal nonlinear mixed effects models.
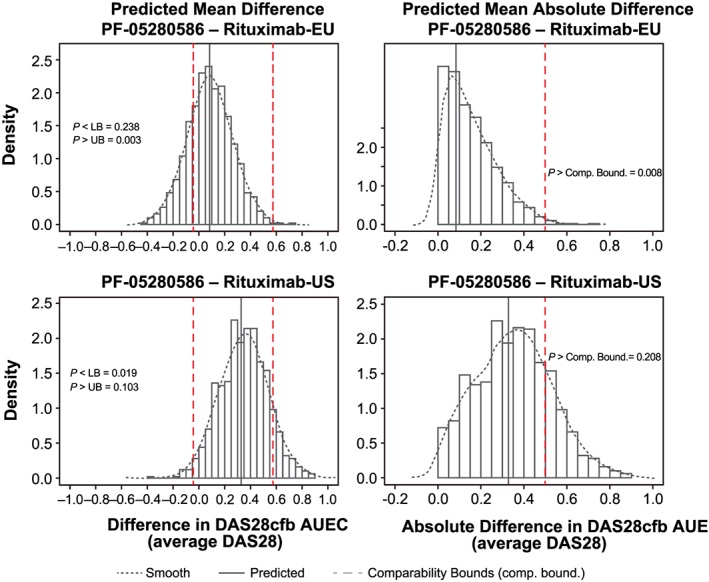
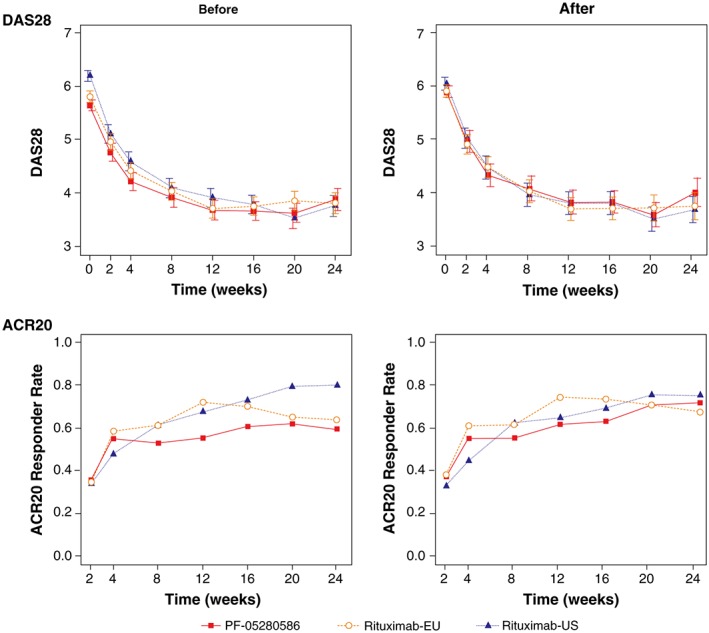
Results: The analysis included 214 patients. Demographics were similar across groups with exceptions in some baseline disease characteristics. Baseline imbalances and group-to-group variation were accounted for by covariate effects in each model. Predictions from the DAS28 and ACR models tracked the central tendency and distribution of observations well. No point estimates of mean differences were outside the reference range for DAS28 or ACR scores. The probabilities that the predicted differences between PF-05280586 vs. rituximab-EU or rituximab-US lie outside the reference ranges were low.
Conclusions: No clinically meaningful differences were detected in DAS28 or ACR response between PF-05280586 and rituximab-EU or rituximab-US as the differences were within the pre-specified reference ranges.
Trial registration number: NCT01526057.
Keywords: Biosimilar; pharmacodynamics; pharmacokinetics.
© 2016 Pfizer Inc. British Journal of Clinical Pharmacology published by John Wiley & Sons Ltd on behalf of British Pharmacological Society.
Figures

Similar articles
-
A phase I pharmacokinetics trial comparing PF-05280586 (a potential biosimilar) and rituximab in patients with active rheumatoid arthritis.Br J Clin Pharmacol. 2016 Jul;82(1):129-38. doi: 10.1111/bcp.12916. Epub 2016 Apr 29. Br J Clin Pharmacol. 2016. PMID: 26909489 Free PMC article. Clinical Trial.
-
A randomized controlled trial comparing PF-06438179/GP1111 (an infliximab biosimilar) and infliximab reference product for treatment of moderate to severe active rheumatoid arthritis despite methotrexate therapy.Arthritis Res Ther. 2018 Jul 27;20(1):155. doi: 10.1186/s13075-018-1646-4. Arthritis Res Ther. 2018. PMID: 30053896 Free PMC article. Clinical Trial.
-
A comparative clinical study of PF-06410293, a candidate adalimumab biosimilar, and adalimumab reference product (Humira®) in the treatment of active rheumatoid arthritis.Arthritis Res Ther. 2018 Aug 15;20(1):178. doi: 10.1186/s13075-018-1676-y. Arthritis Res Ther. 2018. PMID: 30111357 Free PMC article. Clinical Trial.
-
Comparative Efficacy and Safety of Biosimilar Rituximab and Originator Rituximab in Rheumatoid Arthritis and Non-Hodgkin's Lymphoma: A Systematic Review and Meta-analysis.BioDrugs. 2019 Oct;33(5):469-483. doi: 10.1007/s40259-019-00376-z. BioDrugs. 2019. PMID: 31446557
-
GP2013: A Rituximab Biosimilar.BioDrugs. 2017 Oct;31(5):465-468. doi: 10.1007/s40259-017-0245-2. BioDrugs. 2017. PMID: 28921160 Review.
Cited by
-
Structural and functional comparability study of anti-CD20 monoclonal antibody with reference product.Biologics. 2018 Nov 23;12:159-170. doi: 10.2147/BTT.S187744. eCollection 2018. Biologics. 2018. PMID: 30538425 Free PMC article.
-
Efficacy and safety of switching from rituximab to biosimilar CT-P10 in rheumatoid arthritis: 72-week data from a randomized Phase 3 trial.Rheumatology (Oxford). 2019 Dec 1;58(12):2193-2202. doi: 10.1093/rheumatology/kez152. Rheumatology (Oxford). 2019. PMID: 31184752 Free PMC article. Clinical Trial.
-
A Randomized, Double-Blind, Efficacy and Safety Study of PF-05280586 (a Rituximab Biosimilar) Compared with Rituximab Reference Product (MabThera®) in Subjects with Previously Untreated CD20-Positive, Low-Tumor-Burden Follicular Lymphoma (LTB-FL).BioDrugs. 2020 Apr;34(2):171-181. doi: 10.1007/s40259-019-00398-7. BioDrugs. 2020. PMID: 31820339 Free PMC article. Clinical Trial.
-
Monoclonal Antibody and Fusion Protein Biosimilars Across Therapeutic Areas: A Systematic Review of Published Evidence.BioDrugs. 2016 Dec;30(6):489-523. doi: 10.1007/s40259-016-0199-9. BioDrugs. 2016. PMID: 27807766 Free PMC article.
-
A randomised, double-blind trial to demonstrate bioequivalence of GP2013 and reference rituximab combined with methotrexate in patients with active rheumatoid arthritis.Ann Rheum Dis. 2017 Sep;76(9):1598-1602. doi: 10.1136/annrheumdis-2017-211281. Epub 2017 Jun 21. Ann Rheum Dis. 2017. PMID: 28637670 Free PMC article. Clinical Trial.
References
-
- Pope J, Combe B. Unmet needs in the treatment of rheumatoid arthritis. Sci Res 2013; Available at http://dx.doi.org/10.4236/ojra.2013.32011 (last accessed 6 June 2016). - DOI
-
- McCamish M, Woollett G. The state of the art in the development of biosimilars. Clin Pharmacol Ther 2012; 91: 405–417. - PubMed
-
- US Food and Drug Administration . Title VII: improving access to innovative medical therapies. Biologic price competition and innovation (BPCIA) provisions of the Patient Protection and Affordable Care Act (PPACA). Silver Springs, MD: US Department of Health and Human Services, 2010. Available at http://www.fda.gov/downloads/Drugs/GuidanceComplianceRegulatoryInformati... (last accessed 6 June 2016).
Publication types
MeSH terms
Substances
Associated data
LinkOut - more resources
Full Text Sources
Other Literature Sources
Medical
