

reChIP-seq reveals widespread bivalency of H3K4me3 and H3K27me3 in CD4(+) memory T cells
- PMID: 27530917
- PMCID: PMC4992058
- DOI: 10.1038/ncomms12514
reChIP-seq reveals widespread bivalency of H3K4me3 and H3K27me3 in CD4(+) memory T cells
Abstract
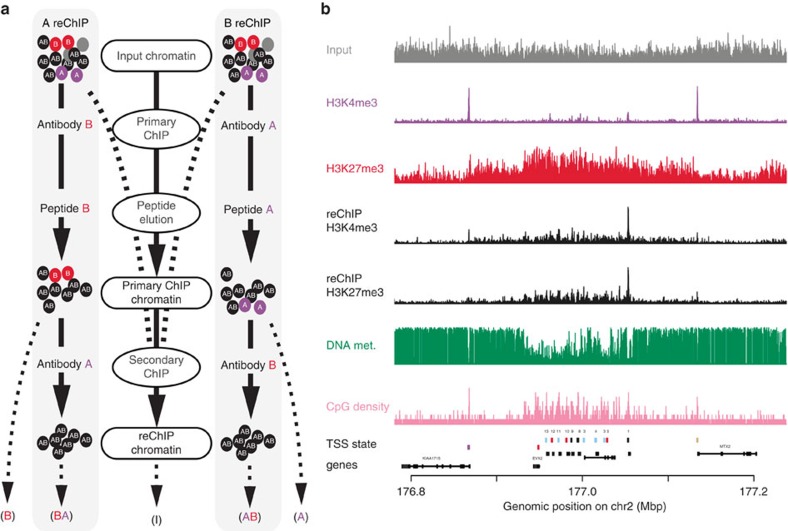
The combinatorial action of co-localizing chromatin modifications and regulators determines chromatin structure and function. However, identifying co-localizing chromatin features in a high-throughput manner remains a technical challenge. Here we describe a novel reChIP-seq approach and tailored bioinformatic analysis tool, normR that allows for the sequential enrichment and detection of co-localizing DNA-associated proteins in an unbiased and genome-wide manner. We illustrate the utility of the reChIP-seq method and normR by identifying H3K4me3 or H3K27me3 bivalently modified nucleosomes in primary human CD4(+) memory T cells. We unravel widespread bivalency at hypomethylated CpG-islands coinciding with inactive promoters of developmental regulators. reChIP-seq additionally uncovered heterogeneous bivalency in the population, which was undetectable by intersecting H3K4me3 and H3K27me3 ChIP-seq tracks. Finally, we provide evidence that bivalency is established and stabilized by an interplay between the genome and epigenome. Our reChIP-seq approach augments conventional ChIP-seq and is broadly applicable to unravel combinatorial modes of action.
Conflict of interest statement
(re)ChIP, RNA and whole-genome bisulfite sequencing data that support the findings of this study have been deposited in the ‘European Genome-Phenome Archive' with the accession code EGAS00001001568. The RNA-seq data for human CD4 central memory T cells referenced in this study are available in the ‘European Nucleotide Archive' with the accession codes ERP004883 ().
Figures


Similar articles
-
Distinct features of H3K4me3 and H3K27me3 chromatin domains in pre-implantation embryos.Nature. 2016 Sep 22;537(7621):558-562. doi: 10.1038/nature19362. Epub 2016 Sep 14. Nature. 2016. PMID: 27626379
-
Genome-wide positioning of bivalent mononucleosomes.BMC Med Genomics. 2016 Sep 15;9(1):60. doi: 10.1186/s12920-016-0221-6. BMC Med Genomics. 2016. PMID: 27634286 Free PMC article.
-
Sequential ChIP-bisulfite sequencing enables direct genome-scale investigation of chromatin and DNA methylation cross-talk.Genome Res. 2012 Jun;22(6):1128-38. doi: 10.1101/gr.133728.111. Epub 2012 Mar 30. Genome Res. 2012. PMID: 22466170 Free PMC article.
-
Application of ChIP-Seq and related techniques to the study of immune function.Immunity. 2011 Jun 24;34(6):830-42. doi: 10.1016/j.immuni.2011.06.002. Immunity. 2011. PMID: 21703538 Free PMC article. Review.
-
Facilitating transcriptional transitions: an overview of chromatin bivalency in plants.J Exp Bot. 2023 Mar 28;74(6):1770-1783. doi: 10.1093/jxb/erad029. J Exp Bot. 2023. PMID: 36656009 Review.
Cited by
-
CRUP: a comprehensive framework to predict condition-specific regulatory units.Genome Biol. 2019 Nov 8;20(1):227. doi: 10.1186/s13059-019-1860-7. Genome Biol. 2019. PMID: 31699133 Free PMC article.
-
Transcriptomic and Epigenetic Alterations in Dendritic Cells Correspond With Chronic Kidney Disease in Lupus Nephritis.Front Immunol. 2019 Aug 27;10:2026. doi: 10.3389/fimmu.2019.02026. eCollection 2019. Front Immunol. 2019. PMID: 31507612 Free PMC article.
-
Epigenome profiling and editing of neocortical progenitor cells during development.EMBO J. 2017 Sep 1;36(17):2642-2658. doi: 10.15252/embj.201796764. Epub 2017 Aug 1. EMBO J. 2017. PMID: 28765163 Free PMC article.
-
Fighting Against Promoter DNA Hyper-Methylation: Protective Histone Modification Profiles of Stress-Resistant Intestinal Stem Cells.Int J Mol Sci. 2020 Mar 12;21(6):1941. doi: 10.3390/ijms21061941. Int J Mol Sci. 2020. PMID: 32178409 Free PMC article.
-
Dynamics of RNA Polymerase II Pausing and Bivalent Histone H3 Methylation during Neuronal Differentiation in Brain Development.Cell Rep. 2017 Aug 8;20(6):1307-1318. doi: 10.1016/j.celrep.2017.07.046. Cell Rep. 2017. PMID: 28793256 Free PMC article.
References
-
- Kornberg R. D. Chromatin structure: a repeating unit of histones and DNA. Science 184, 868–871 (1974). - PubMed
-
- Luger K., Mäder A. W., Richmond R. K., Sargent D. F. & Richmond T. J. Crystal structure of the nucleosome core particle at 2.8 A resolution. Nature 389, 251–260 (1997). - PubMed
-
- Strahl B. D. & Allis C. D. The language of covalent histone modifications. Nature 403, 41–45 (2000). - PubMed
-
- Jenuwein T. & Allis C. D. Translating the histone code. Science 293, 1074–1080 (2001). - PubMed
-
- Bernstein B. E. et al.. A bivalent chromatin structure marks key developmental genes in embryonic stem cells. Cell 125, 315–326 (2006). - PubMed
Publication types
MeSH terms
Substances
LinkOut - more resources
Full Text Sources
Other Literature Sources
Research Materials
