Simultaneous Evaluation of Life Cycle Dynamics between a Host Paramecium and the Endosymbionts of Paramecium bursaria Using Capillary Flow Cytometry
- PMID: 27531180
- PMCID: PMC4987690
- DOI: 10.1038/srep31638
Simultaneous Evaluation of Life Cycle Dynamics between a Host Paramecium and the Endosymbionts of Paramecium bursaria Using Capillary Flow Cytometry
Abstract
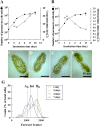
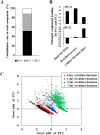
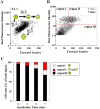
Endosymbioses are driving forces underlying cell evolution. The endosymbiosis exhibited by Paramecium bursaria is an excellent model with which to study symbiosis. A single-cell microscopic analysis of P. bursaria reveals that endosymbiont numbers double when the host is in the division phase. Consequently, endosymbionts must arrange their cell cycle schedule if the culture-condition-dependent change delays the generation time of P. bursaria. However, it remains poorly understood whether endosymbionts keep pace with the culture-condition-dependent behaviors of P. bursaria, or not. Using microscopy and flow cytometry, this study investigated the life cycle behaviors occurring between endosymbionts and the host. To establish a connection between the host cell cycle and endosymbionts comprehensively, multivariate analysis was applied. The multivariate analysis revealed important information related to regulation between the host and endosymbionts. Results show that dividing endosymbionts underwent transition smoothly from the division phase to interphase, when the host was in the logarithmic phase. In contrast, endosymbiont division stagnated when the host was in the stationary phase. This paper explains that endosymbionts fine-tune their cell cycle pace with their host and that a synchronous life cycle between the endosymbionts and the host is guaranteed in the symbiosis of P. bursaria.
Figures


Similar articles
-
Maintenance of algal endosymbionts in Paramecium bursaria: a simple model based on population dynamics.Environ Microbiol. 2016 Sep;18(8):2435-45. doi: 10.1111/1462-2920.13140. Epub 2016 Jan 18. Environ Microbiol. 2016. PMID: 26625979
-
Endosymbionts in paramecium.Eur J Protistol. 2012 May;48(2):124-37. doi: 10.1016/j.ejop.2011.10.002. Epub 2011 Dec 6. Eur J Protistol. 2012. PMID: 22153895
-
Shining a Light on Exploitative Host Control in a Photosynthetic Endosymbiosis.Curr Biol. 2016 Jan 25;26(2):207-211. doi: 10.1016/j.cub.2015.11.052. Epub 2015 Dec 31. Curr Biol. 2016. PMID: 26748854
-
Symbiosis in Paramecium Bursaria.Symp Soc Exp Biol. 1975;(29):145-73. Symp Soc Exp Biol. 1975. PMID: 785659 Review.
-
Mechanisms for establishing primary and secondary endosymbiosis in Paramecium.J Eukaryot Microbiol. 2022 Sep;69(5):e12901. doi: 10.1111/jeu.12901. Epub 2022 Mar 19. J Eukaryot Microbiol. 2022. PMID: 35243727 Review.
Cited by
-
SymbiQuant: A Machine Learning Object Detection Tool for Polyploid Independent Estimates of Endosymbiont Population Size.Front Microbiol. 2022 May 19;13:816608. doi: 10.3389/fmicb.2022.816608. eCollection 2022. Front Microbiol. 2022. PMID: 35663891 Free PMC article.
-
The impacts of host association and perturbation on symbiont fitness.Symbiosis. 2024;92(3):439-451. doi: 10.1007/s13199-024-00984-6. Epub 2024 Apr 2. Symbiosis. 2024. PMID: 38666134 Free PMC article.
-
Endosymbiotic Chlorella variabilis reduces mitochondrial number in the ciliate Paramecium bursaria.Sci Rep. 2022 May 30;12(1):8216. doi: 10.1038/s41598-022-12496-8. Sci Rep. 2022. PMID: 35637201 Free PMC article.
-
Examining the Relationship Between the Testate Amoeba Hyalosphenia papilio (Arcellinida, Amoebozoa) and its Associated Intracellular Microalgae Using Molecular and Microscopic Methods.Protist. 2022 Feb;173(1):125853. doi: 10.1016/j.protis.2021.125853. Epub 2021 Dec 15. Protist. 2022. PMID: 35030517 Free PMC article.
-
Method for Stress Assessment of Endosymbiotic Algae in Paramecium bursaria as a Model System for Endosymbiosis.Microorganisms. 2022 Jun 18;10(6):1248. doi: 10.3390/microorganisms10061248. Microorganisms. 2022. PMID: 35744766 Free PMC article.
References
-
- Reyes-Prieto A., Weber A. P. M. & Bhattacharya D. The Origin and Establishment of the Plastid in Algae and Plants. Annu. Rev. Genet. 41, 147–168 (2007). - PubMed
-
- Zimorski V., Ku C. Martin W. F. & Gould S. B. Endosymbiotic theory for organelle origins. Curr. Opin. Microbiol. 22, 38–48 (2014). - PubMed
-
- de Vries J., Stanton A., Archibald J. M. & Gould S. B. Streptophyte Terrestrialization in Light of Plastid Evolution. Trends Plant Sci. 21, 467–476 (2016). - PubMed
Publication types
MeSH terms
LinkOut - more resources
Full Text Sources
Other Literature Sources

