. 2016 Aug 17:7:12534.
doi: 10.1038/ncomms12534.

Telomeric RNAs are essential to maintain telomeres

Affiliations

Telomeric RNAs are essential to maintain telomeres

Juan José Montero et al. Nat Commun. .

Abstract

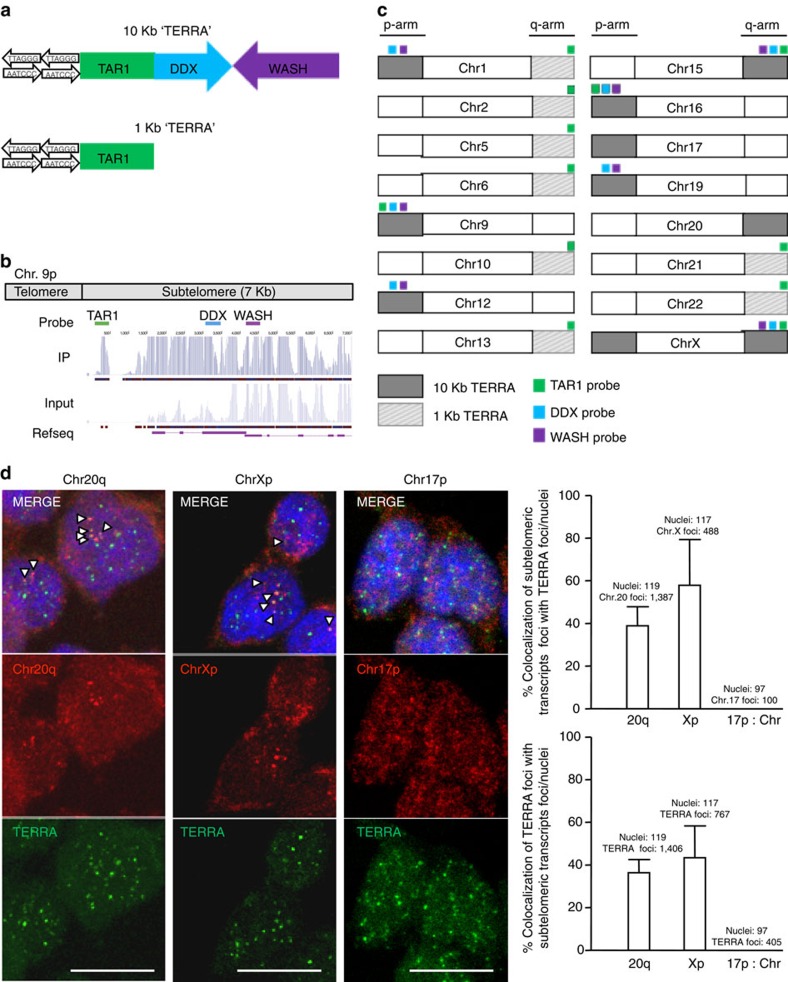
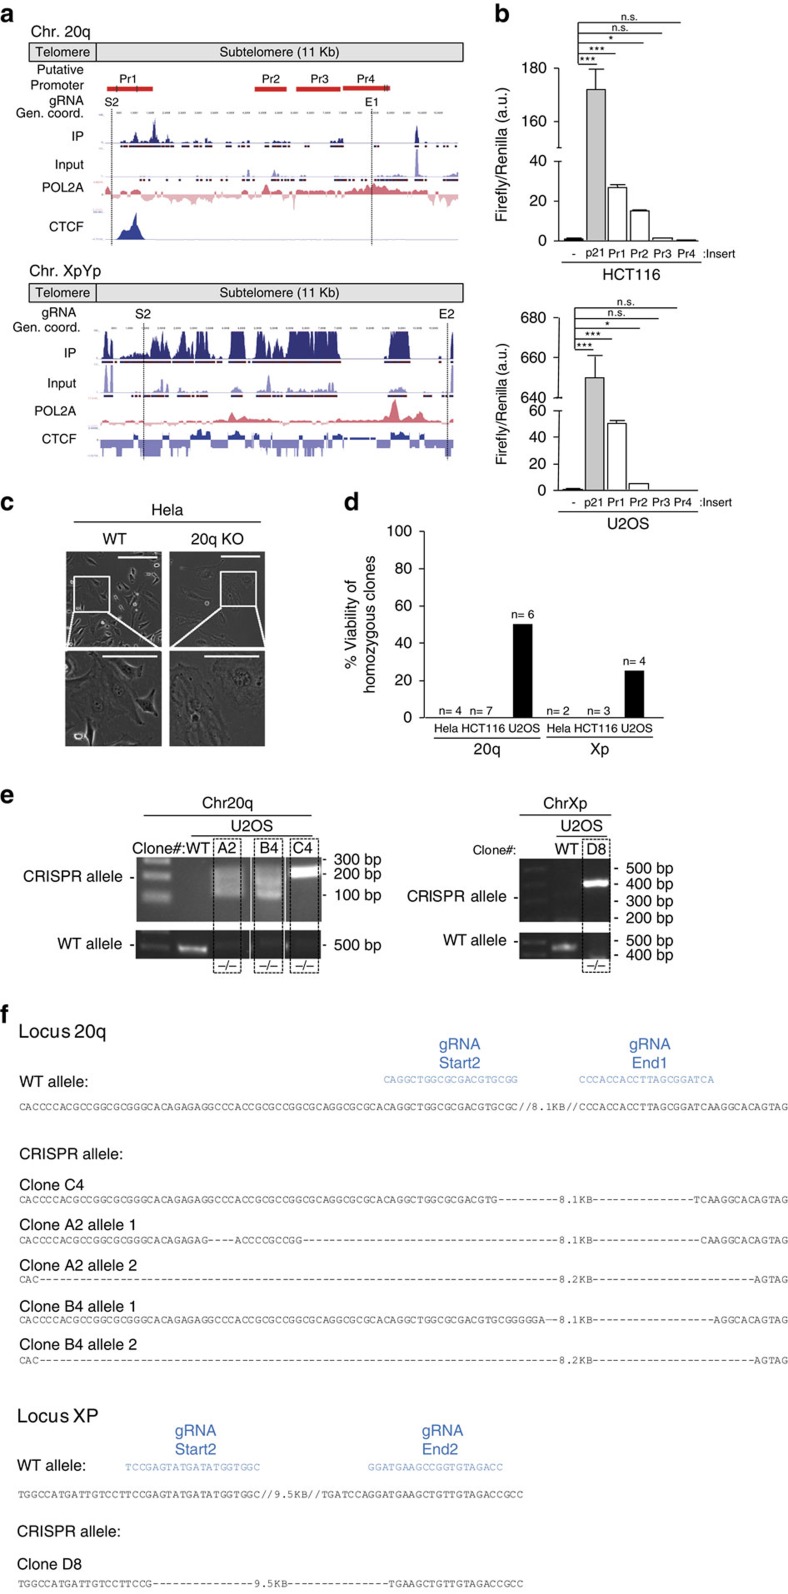
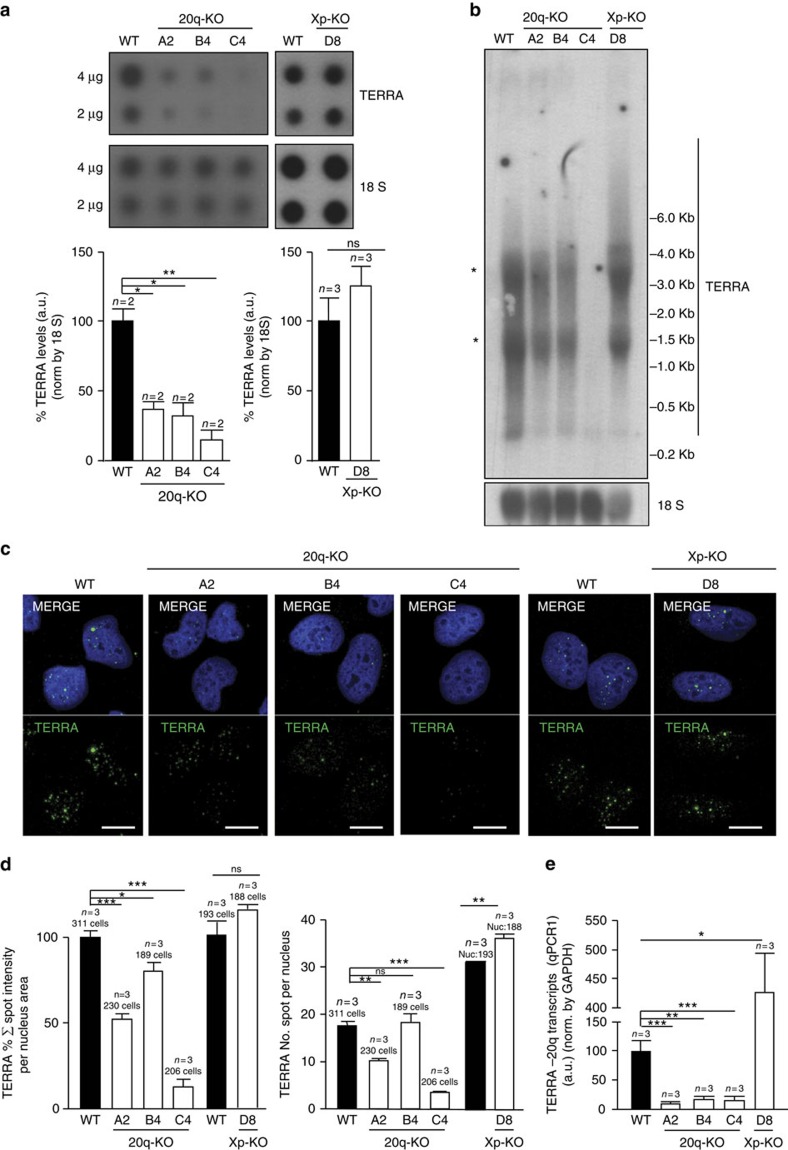
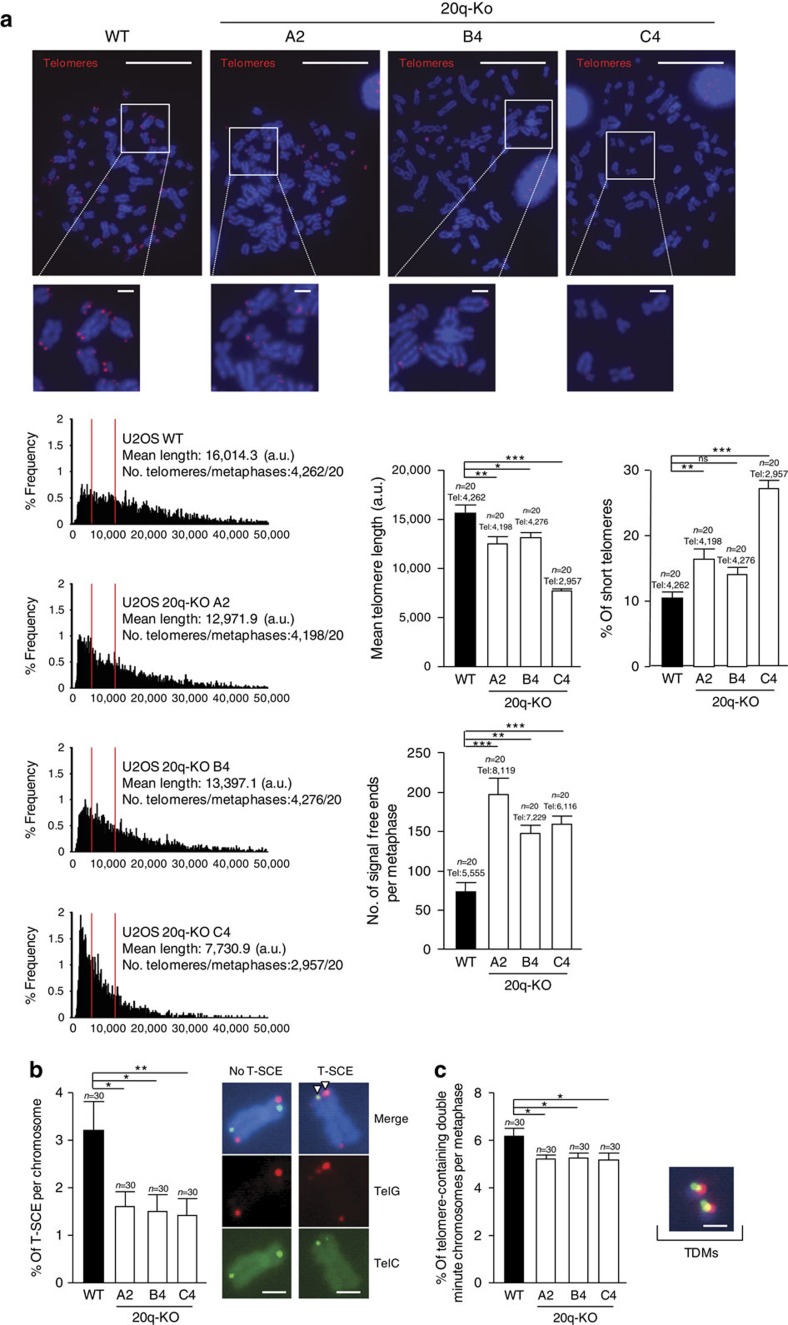
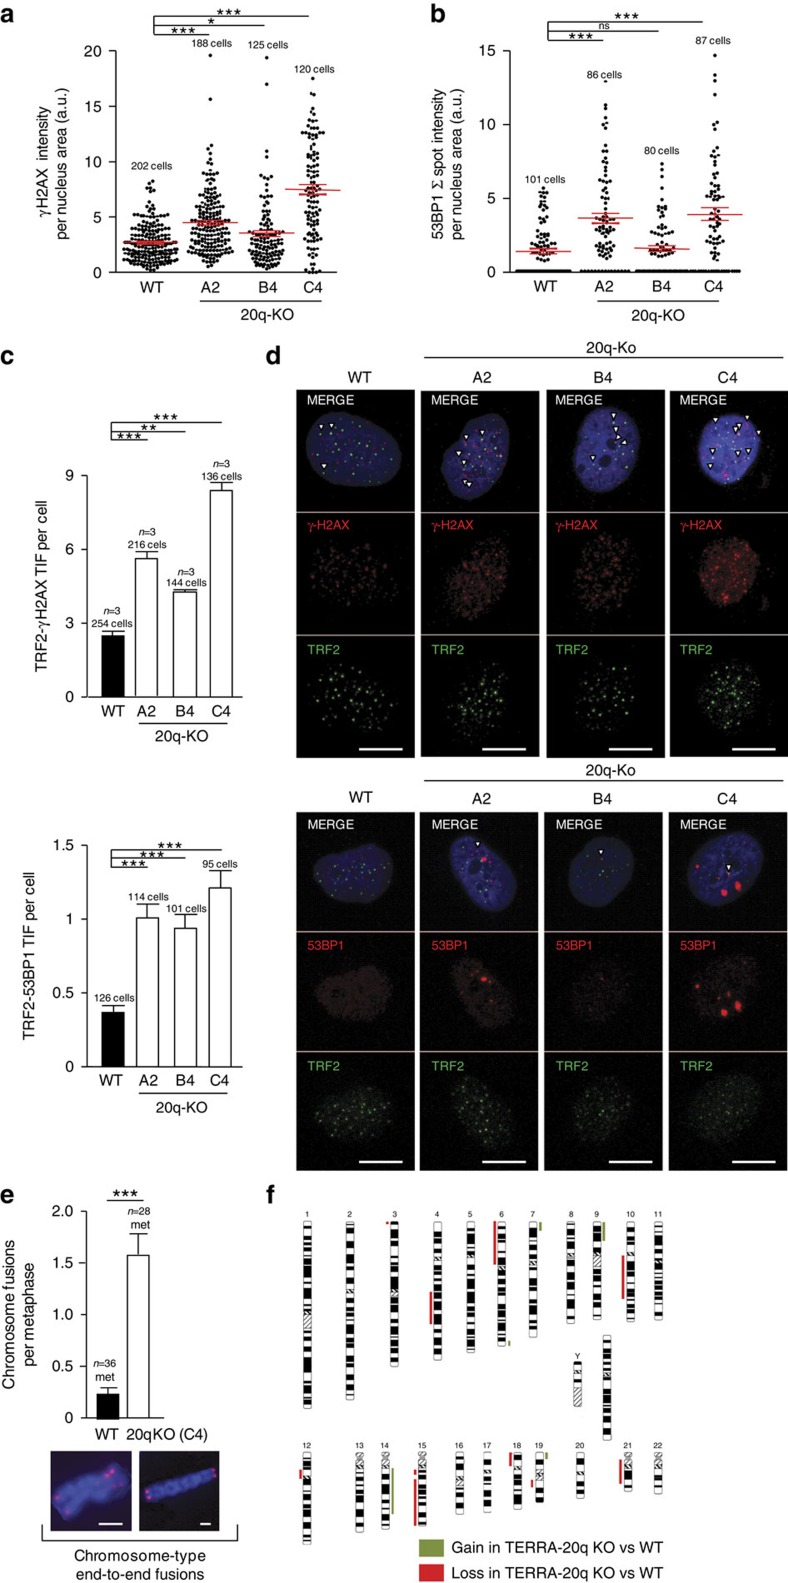
Telomeres are transcribed generating long non-coding RNAs known as TERRA. Deciphering the role of TERRA has been one of the unsolved issues of telomere biology in the past decade. This has been, in part, due to lack of knowledge on the TERRA loci, thus preventing functional genetic studies. Here, we describe that long non-coding RNAs with TERRA features are transcribed from the human 20q and Xp subtelomeres. Deletion of the 20q locus by using the CRISPR-Cas9 technology causes a dramatic decrease in TERRA levels, while deletion of the Xp locus does not result in decreased TERRA levels. Strikingly, 20q-TERRA ablation leads to dramatic loss of telomere sequences and the induction of a massive DNA damage response. These findings identify chromosome 20q as a main TERRA locus in human cells and represent the first demonstration in any organism of the essential role of TERRA in the maintenance of telomeres.


Figures

Figure 1
Figure 1. Transcripts arising from the subtelomere of chromosomes 20q and Xp co-localize with TERRA.
(a) Schematic of the three motifs in the structurally conserved TERRA loci proposed in Porro et al.,, the repetitive region TAR1 and the two lncRNA families, DDX11L and WASH. (b) Example of the position of the probes against the structurally conserved motifs in the subtelomere of chromosome 9p. The alignment of the RNA-seq reads obtained in a TERRA-IP compared with the input and an annotated Ref seq in this region is also shown. (c) Schematic of the position of TERRA loci proposed in Porro et al., within all chromosomes. The 10 kb TERRA is coloured in grey and the 1-kb TERRA with stripes. The position of the probes against TAR1, DDX11L and WASH is also indicated in different colours. (d) Confocal microscopy images of double RNA-FISH using probes targeting either subtelomere 20q, Xp or 17p transcripts (red) and TERRA's telomeric tract (green). The representative images are the merge of four individual confocal images. Co-localization events were only counted as positive when detected in the individual confocal images. Arrowheads indicate real co-localization events detected in the individual confocal images. (Top graph) The percentage of co-localization of either subtelomere 20q foci or subtelomere Xp foci with TERRA foci with respect the total number of 20q or Xp foci is represented (mean±s.d., n=number of nuclei). Total number of nuclei and foci are also indicated. (Bottom graph) The percentage of co-localization of TERRA foci with either subtelomere 20q foci or subtelomere Xp foci with respect the total number of TERRA foci is also represented (mean±s.d., n=number of nuclei). Total number of nuclei and foci are also indicated. Scale bar, 10 μm.
Figure 2
Figure 2. Deletion of the 20q-TERRA locus in different human cell lines using the CRISPR-Cas9 system.
(a) Snapshot depicting, from top to bottom, putative promoter regions (Pr1, Pr2, Pr2 and Pr4), gRNA position, genomic coordinates, RNA-seq from TERRA IP and input, and RNA polymerase 2A (POL2A) and CTCF ChIP-seq data. S2, E1, S2 and E2 are the names of the different gRNAs. (b) Graph shows the relative fold increase in firefly luciferase activity seen in the pGL3-containing promoter regions (Pr1-4) relative to the empty vector after normalization to renilla activity. (Mean values±s.e.m., n=3 independent experiments). p21 promoter serves as positive control. One-way Anova with the Dunnett's post test was used for statistical analysis (*P<0.05 and ***P<0.001). (c) Representative image of the HeLa clones homozygous for the 20q-TERRA deletion during expansion. Zoom areas are shown. Scale bar, 500 μm and (zoom) 250 μm. (d) Percentage of viability of the different homozygous clones for the 20q and Xp deletion on expansion of the three different cell lines. (e) Ethidium bromide gels showing the CRISPR allele for the deletion of the 20q and Xp loci detected by PCR in different clones of the U2OS cells. The white strips in the gels indicate the removal of irrelevant samples from that gel. (f) Schematic of the sequencing of the CRISPR allele for the deletion of the 20q (clones A2, B4 and C4) and Xp (clone D8) loci compared with the WT allele. Slashes (//) represent omitted DNA sequence. The size of the omitted sequence is shown. Dashes (-) represent the deleted sequence. The size of the deleted sequence is shown. gRNAs are shown in blue.
Figure 3
Figure 3. Deletion of the TERRA-20q locus dramatically affects TERRA expression.
(a) RNA from the U2OS cells WT or from the three 20q-KO clones (A2, B4 and C4) and the Xp-KO (D8) clone was isolated and used for TERRA detection by RNA dot-blot with a probe against the TERRA-UUAGGG-tract; 18S serves as loading control. (Graph) TERRA quantification normalized by 18S (mean values±s.e.m.). (b) Northern blotting using 32P-dCTP-labelled probe against TERRA-UUAGGG-tract in the U2OS cells WT or KO for the 20q or Xp loci. 18S was included as a loading control. *Unspecific band due to cross-hybridization with rRNA 18S and 28S. (c) Representative confocal microscopy images of RNA-FISH against TERRA-UUAGGG-tract (green) in the U2OS cells WT and KO for the 20q (clones A2, B4 C4) and the Xp (clone D8) loci. Scale bar, 10 μm. (d) The graphs show (left) the quantification of the total spot intensity per nucleus normalized by nucleus area, (right) the total number of spots per nucleus in the three 20q-KO clones and in the Xp-KO clone D8 (mean values±s.e.m., n=3 independent experiments). (e) Detection of the 20q-TERRA transcripts by qPCR (primers were designed in the subtelomeric region). The percentage of enrichment of the 20q-TERRA transcripts in WT and in the 20q-KO clones (clones A2, B4 and C4) and in the Xp-KO (clone D8) normalized by GAPDH is shown. One-way Anova with Dunnett's post test was used for the statistical analysis of the 20q clones and the Student's t-test for the Xp clone (*P<0.05, **P<0.01 and ***P<0.001).
Figure 4
Figure 4. Deletion of the 20q-TERRA locus decreases telomere length and protection in U2OS cells.
(a) Q-FISH images obtained from metaphases spreads from U2OS cells WT and KO for the Chr20q-TERRA locus (clones A4, B4 and C4). (Left graphs) Frequency graphs of telomere length (a.u.) distribution measured in WT and in the 20q-KO cells (clones A4, B4 and C4) from three independent experiments. The mean telomere length and the number of telomeres and metaphases analyzed is shown. The red lines are arbitrary lines placed in the exact same position in each frequency graph to visualize differences between the 20q-KO clones and the WT controls (right graphs) The mean telomere length, the percentage of short telomeres and the quantification of signal-free ends per metaphase are also represented. Short telomeres are considered those in the 10% percentile of the total telomere length distribution. Total number of metaphases used for the statistical analysis is indicated. Scale bar, 10 μm and (zoom) 1 μm. (b) WT and 20q-KO cells were analyzed for T-SCE events with G-rich (green) and C-rich (red) PNA probes. The fraction of chromosome ends with T-SCE obtained from three different experiments was quantified and graphed as the mean values±s.e.m., n=30 metaphases. The number of metaphases analyzed is shown. Only events in which interchange of both colours were quantified (see examples of no-T-SCE and T-SCE). The quantification was carried out by counting the number of events in the same chromosome or in different chromosomes and then normalizing it by the total number of chromosomes observed in each metaphase. Scale bar, 1 μm. (c) Quantification of DNA-containing double minute chromosomes (TDMs) in WT and 20q-KO cells from three different experiments (mean values±s.e.m., n=30 metaphases). An example of TDMs is shown. One-way Anova with Dunnett's post test was used for all statistical analysis (*P<0.05, **P<0.01 and ***P<0.001). Scale bar, 1 μm.
Figure 5
Figure 5. Deletion of the 20q-TERRA locus decreases telomere protection in U2OS cells.
(a) Quantification of the total γH2AX signal per nucleus (mean values±s.e.m., n=number of cells) is shown. The total number of cells analyzed is indicated. (b) Quantification of the total 53BP1 spot signal per nucleus (mean values±s.e.m., n=number of cells is shown). The total number of cells analyzed is indicated. (c) Graphs showing the quantification of the co-localization (TIF) between TRF2 and either γH2AX or 53BP1 in WT cells and in all 20q-KO clones (mean values±s.e.m., n=3 independent experiments for γH2AX and n=number of cells for 53BP1) per cell is shown. The total number of nuclei analyzed is indicated. (d) Representative images of the average number of TIFs found on double inmunostain to detect the telomere protein TRF2 (green) and either the DNA damage markers phospho-Histone γH2AX or 53BP1 (red) in the U2OS cells WT or deleted for the 20q locus. Arrowheads indicate co-localization events. Scale bar, 10 μm. (e) Quantification of chromosomal end-to-end fusions in WT and in the 20q-KO cells from three independent experiments (mean values±s.e.m., n=metaphases). Examples of end-to-end fusions are shown as well. Scale bar, 1 μm. (f) Array-CGH analysis was performed on hybridization on the same membrane of DNA differentially labelled from WT and 20q-KO cells. The chromosomal gains and losses in 20q-KO cells normalized by WT cells are represented. The chromosomal gains are shown in green and in red the chromosomal losses. One-way Anova with Dunnett's post test was used for all statistical analysis except for the quantification of chromosomal fusions in which the Student's t-test was used (*P<0.05, **P<0.01 and ***P<0.001).

Comment in

References

    1. Azzalin C. M., Reichenbach P., Khoriauli L., Giulotto E. & Lingner J. Telomeric repeat containing RNA and RNA surveillance factors at mammalian chromosome ends. Science 318, 798–801 (2007). - PubMed
    1. Schoeftner S. & Blasco M. A. Developmentally regulated transcription of mammalian telomeres by DNA-dependent RNA polymerase II. Nat. Cell Biol. 10, 228–236 (2008). - PubMed
    1. Lopez de Silanes I. et al.. Identification of TERRA locus unveils a telomere protection role through association to nearly all chromosomes. Nat. Commun. 5, 4723 (2014). - PMC - PubMed
    1. Deng Z., Norseen J., Wiedmer A., Riethman H. & Lieberman P. M. TERRA RNA binding to TRF2 facilitates heterochromatin formation and ORC recruitment at telomeres. Mol. Cell 35, 403–413 (2009). - PMC - PubMed
    1. Lopez de Silanes I., Stagno d'Alcontres M. & Blasco M. A. TERRA transcripts are bound by a complex array of RNA-binding proteins. Nat. Commun. 1, 33 (2010). - PubMed

Publication types