

Label-free detection of real-time DNA amplification using a nanofluidic diffraction grating
- PMID: 27531471
- PMCID: PMC4987677
- DOI: 10.1038/srep31642
Label-free detection of real-time DNA amplification using a nanofluidic diffraction grating
Abstract
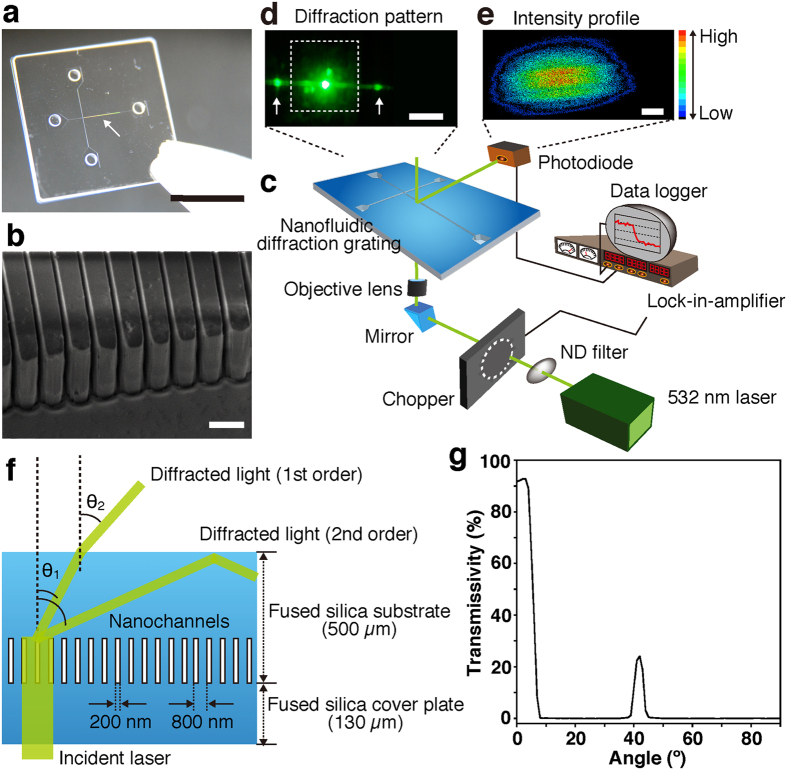
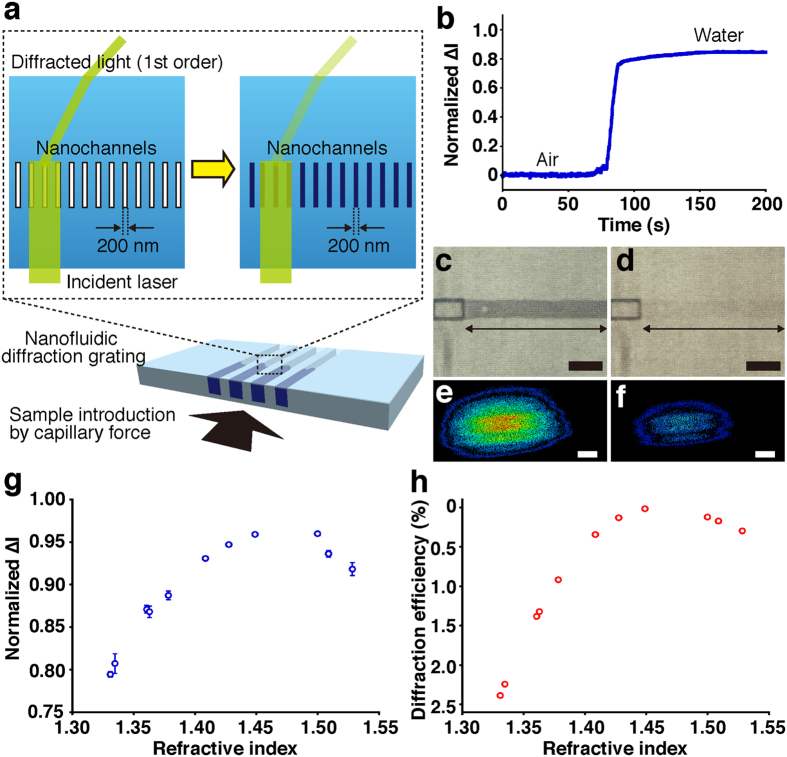
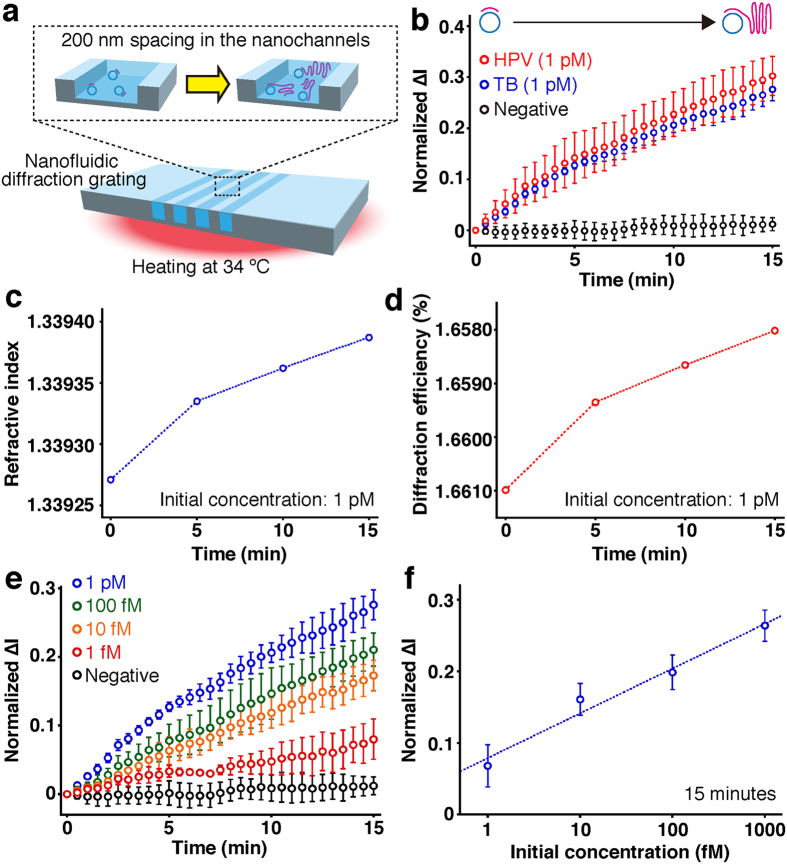
Quantitative DNA amplification using fluorescence labeling has played an important role in the recent, rapid progress of basic medical and molecular biological research. Here we report a label-free detection of real-time DNA amplification using a nanofluidic diffraction grating. Our detection system observed intensity changes during DNA amplification of diffracted light derived from the passage of a laser beam through nanochannels embedded in a microchannel. Numerical simulations revealed that the diffracted light intensity change in the nanofluidic diffraction grating was attributed to the change of refractive index. We showed the first case reported to date for label-free detection of real-time DNA amplification, such as specific DNA sequences from tubercle bacilli (TB) and human papillomavirus (HPV). Since our developed system allows quantification of the initial concentration of amplified DNA molecules ranging from 1 fM to 1 pM, we expect that it will offer a new strategy for developing fundamental techniques of medical applications.
Figures
Similar articles
-
Sensitive sequence-specific molecular identification system comprising an aluminum micro-nanofluidic chip and associated real-time confocal detector.Anal Chim Acta. 2011 Jun 10;695(1-2):1-10. doi: 10.1016/j.aca.2011.03.040. Epub 2011 Mar 30. Anal Chim Acta. 2011. PMID: 21601025
-
SlipChip Device for Digital Nucleic Acid Amplification.Methods Mol Biol. 2017;1547:123-132. doi: 10.1007/978-1-4939-6734-6_10. Methods Mol Biol. 2017. PMID: 28044292
-
A simple, low-cost, and rapid device for a DNA methylation-specific amplification/detection system using a flexible plastic and silicon complex.Lab Chip. 2014 Nov 7;14(21):4220-9. doi: 10.1039/c4lc00804a. Lab Chip. 2014. PMID: 25184832
-
Microfluidic DNA amplification--a review.Anal Chim Acta. 2009 Apr 13;638(2):115-25. doi: 10.1016/j.aca.2009.02.038. Epub 2009 Mar 4. Anal Chim Acta. 2009. PMID: 19327449 Review.
-
Integration of isothermal amplification methods in microfluidic devices: Recent advances.Biosens Bioelectron. 2017 Apr 15;90:174-186. doi: 10.1016/j.bios.2016.11.045. Epub 2016 Nov 19. Biosens Bioelectron. 2017. PMID: 27888686 Review.
Cited by
-
Surface Micro-Patterned Biofunctionalized Hydrogel for Direct Nucleic Acid Hybridization Detection.Biosensors (Basel). 2023 Feb 23;13(3):312. doi: 10.3390/bios13030312. Biosensors (Basel). 2023. PMID: 36979524 Free PMC article.
-
All-fiber all-optical quantitative polymerase chain reaction (qPCR).Sens Actuators B Chem. 2020 Nov 15;323:128681. doi: 10.1016/j.snb.2020.128681. Epub 2020 Aug 9. Sens Actuators B Chem. 2020. PMID: 32834504 Free PMC article.
-
Critical Review: digital resolution biomolecular sensing for diagnostics and life science research.Lab Chip. 2020 Aug 21;20(16):2816-2840. doi: 10.1039/d0lc00506a. Epub 2020 Jul 23. Lab Chip. 2020. PMID: 32700698 Free PMC article. Review.
-
Advances in Label-Free Detections for Nanofluidic Analytical Devices.Micromachines (Basel). 2020 Sep 23;11(10):885. doi: 10.3390/mi11100885. Micromachines (Basel). 2020. PMID: 32977690 Free PMC article. Review.
-
Rolling Circle Amplification in Integrated Microsystems: An Uncut Gem toward Massively Multiplexed Pathogen Diagnostics and Genotyping.Acc Chem Res. 2021 Nov 2;54(21):3979-3990. doi: 10.1021/acs.accounts.1c00438. Epub 2021 Oct 12. Acc Chem Res. 2021. PMID: 34637281 Free PMC article. Review.
References
-
- Higuchi R., Fockler C., Dollinger G. & Watson R. Kinetic Pcr Analysis-Real-Time Monitoring of DNA Amplification Reactions. Biotechnology 11, 1026–1030 (1993). - PubMed
-
- Jarvius J. et al. Digital quantification using amplified single-molecule detection. Nat. Methods 3, 725–727 (2006). - PubMed
-
- Thomson E. & Vincent R. Reagent volume and plate bias in real-time polymerase chain reaction. Anal. Biochem. 337, 347–350 (2005). - PubMed
Publication types
MeSH terms
Substances
LinkOut - more resources
Full Text Sources
Other Literature Sources
