

Indels, structural variation, and recombination drive genomic diversity in Plasmodium falciparum
- PMID: 27531718
- PMCID: PMC5052046
- DOI: 10.1101/gr.203711.115
Indels, structural variation, and recombination drive genomic diversity in Plasmodium falciparum
Abstract
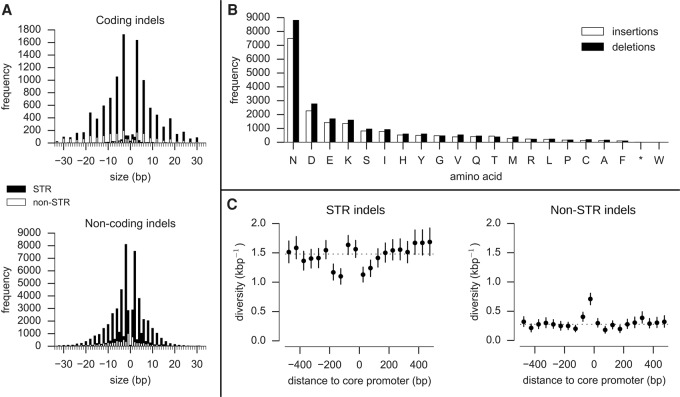
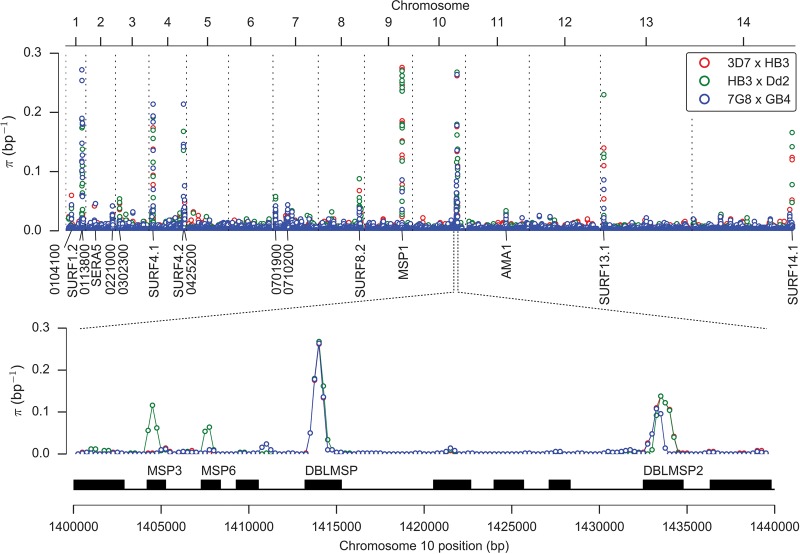
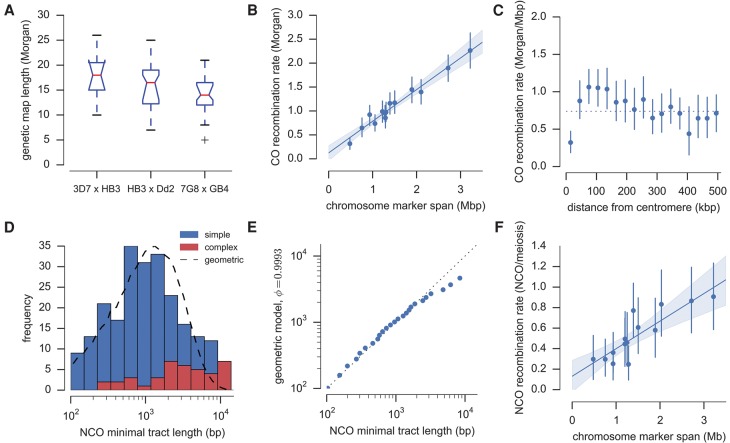
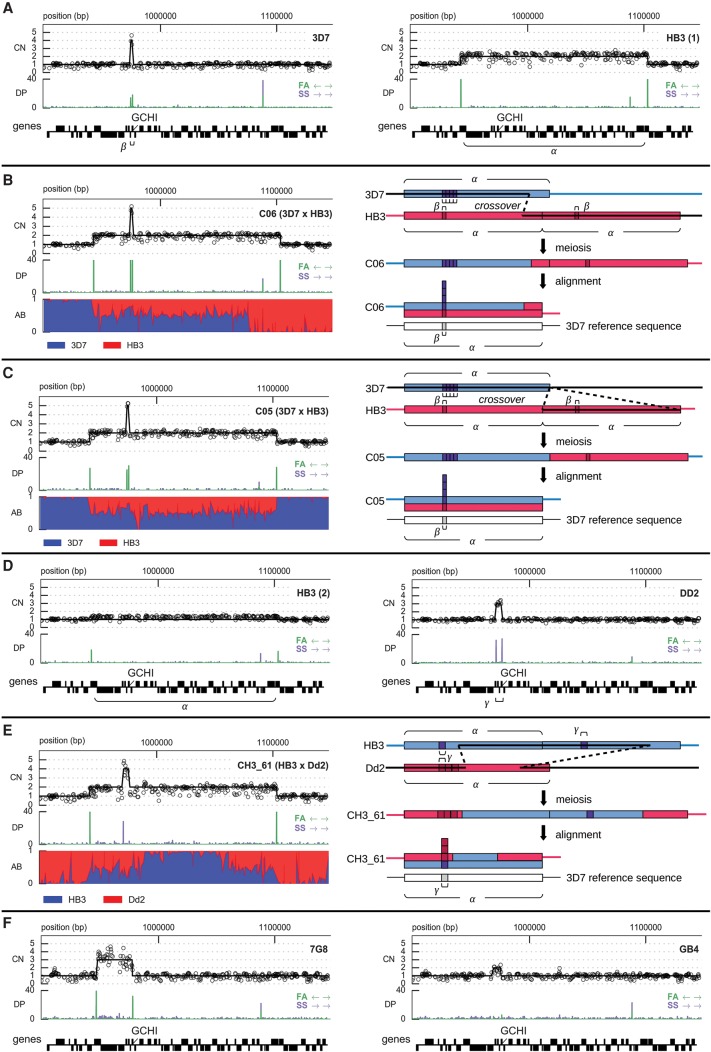
The malaria parasite Plasmodium falciparum has a great capacity for evolutionary adaptation to evade host immunity and develop drug resistance. Current understanding of parasite evolution is impeded by the fact that a large fraction of the genome is either highly repetitive or highly variable and thus difficult to analyze using short-read sequencing technologies. Here, we describe a resource of deep sequencing data on parents and progeny from genetic crosses, which has enabled us to perform the first genome-wide, integrated analysis of SNP, indel and complex polymorphisms, using Mendelian error rates as an indicator of genotypic accuracy. These data reveal that indels are exceptionally abundant, being more common than SNPs and thus the dominant mode of polymorphism within the core genome. We use the high density of SNP and indel markers to analyze patterns of meiotic recombination, confirming a high rate of crossover events and providing the first estimates for the rate of non-crossover events and the length of conversion tracts. We observe several instances of meiotic recombination within copy number variants associated with drug resistance, demonstrating a mechanism whereby fitness costs associated with resistance mutations could be compensated and greater phenotypic plasticity could be acquired.
© 2016 Miles et al.; Published by Cold Spring Harbor Laboratory Press.
Figures
Similar articles
-
High recombination rates and hotspots in a Plasmodium falciparum genetic cross.Genome Biol. 2011;12(4):R33. doi: 10.1186/gb-2011-12-4-r33. Epub 2011 Apr 4. Genome Biol. 2011. PMID: 21463505 Free PMC article.
-
Exploration of copy number variation in genes related to anti-malarial drug resistance in Plasmodium falciparum.Gene. 2020 Apr 30;736:144414. doi: 10.1016/j.gene.2020.144414. Epub 2020 Jan 30. Gene. 2020. PMID: 32006594 Review.
-
High-throughput 454 resequencing for allele discovery and recombination mapping in Plasmodium falciparum.BMC Genomics. 2011 Feb 17;12:116. doi: 10.1186/1471-2164-12-116. BMC Genomics. 2011. PMID: 21324207 Free PMC article.
-
Genome scanning of Amazonian Plasmodium falciparum shows subtelomeric instability and clindamycin-resistant parasites.Genome Res. 2010 Nov;20(11):1534-44. doi: 10.1101/gr.105163.110. Epub 2010 Sep 9. Genome Res. 2010. PMID: 20829224 Free PMC article.
-
Recent advances in malaria genomics and epigenomics.Genome Med. 2016 Sep 7;8(1):92. doi: 10.1186/s13073-016-0343-7. Genome Med. 2016. PMID: 27605022 Free PMC article. Review.
Cited by
-
De Novo Mutations Resolve Disease Transmission Pathways in Clonal Malaria.Mol Biol Evol. 2018 Jul 1;35(7):1678-1689. doi: 10.1093/molbev/msy059. Mol Biol Evol. 2018. PMID: 29722884 Free PMC article.
-
Estimating Relatedness Between Malaria Parasites.Genetics. 2019 Aug;212(4):1337-1351. doi: 10.1534/genetics.119.302120. Epub 2019 Jun 17. Genetics. 2019. PMID: 31209105 Free PMC article.
-
Optimization of parasite DNA enrichment approaches to generate whole genome sequencing data for Plasmodium falciparum from low parasitaemia samples.Malar J. 2020 Mar 30;19(1):135. doi: 10.1186/s12936-020-03195-8. Malar J. 2020. PMID: 32228559 Free PMC article.
-
Culture adaptation of malaria parasites selects for convergent loss-of-function mutants.Sci Rep. 2017 Jan 24;7:41303. doi: 10.1038/srep41303. Sci Rep. 2017. PMID: 28117431 Free PMC article.
-
Panoptes: web-based exploration of large scale genome variation data.Bioinformatics. 2017 Oct 15;33(20):3243-3249. doi: 10.1093/bioinformatics/btx410. Bioinformatics. 2017. PMID: 29028261 Free PMC article.
References
-
- Baudat F, de Massy B. 2007. Regulating double-stranded DNA break repair towards crossover or non-crossover during mammalian meiosis. Chromosome Res 15: 565–577. - PubMed
Publication types
MeSH terms
Grants and funding
LinkOut - more resources
Full Text Sources
Other Literature Sources