. 2016 Oct 7;291(41):21350-21362.
doi: 10.1074/jbc.M116.732479. Epub 2016 Aug 16.

Direct Functional Interaction of the Kinesin-13 Family Member Kinesin-like Protein 2A (Kif2A) and Arf GAP with GTP-binding Protein-like, Ankyrin Repeats and PH Domains1 (AGAP1)

Affiliations

Direct Functional Interaction of the Kinesin-13 Family Member Kinesin-like Protein 2A (Kif2A) and Arf GAP with GTP-binding Protein-like, Ankyrin Repeats and PH Domains1 (AGAP1)

Ruibai Luo et al. J Biol Chem. .

Erratum in

Abstract

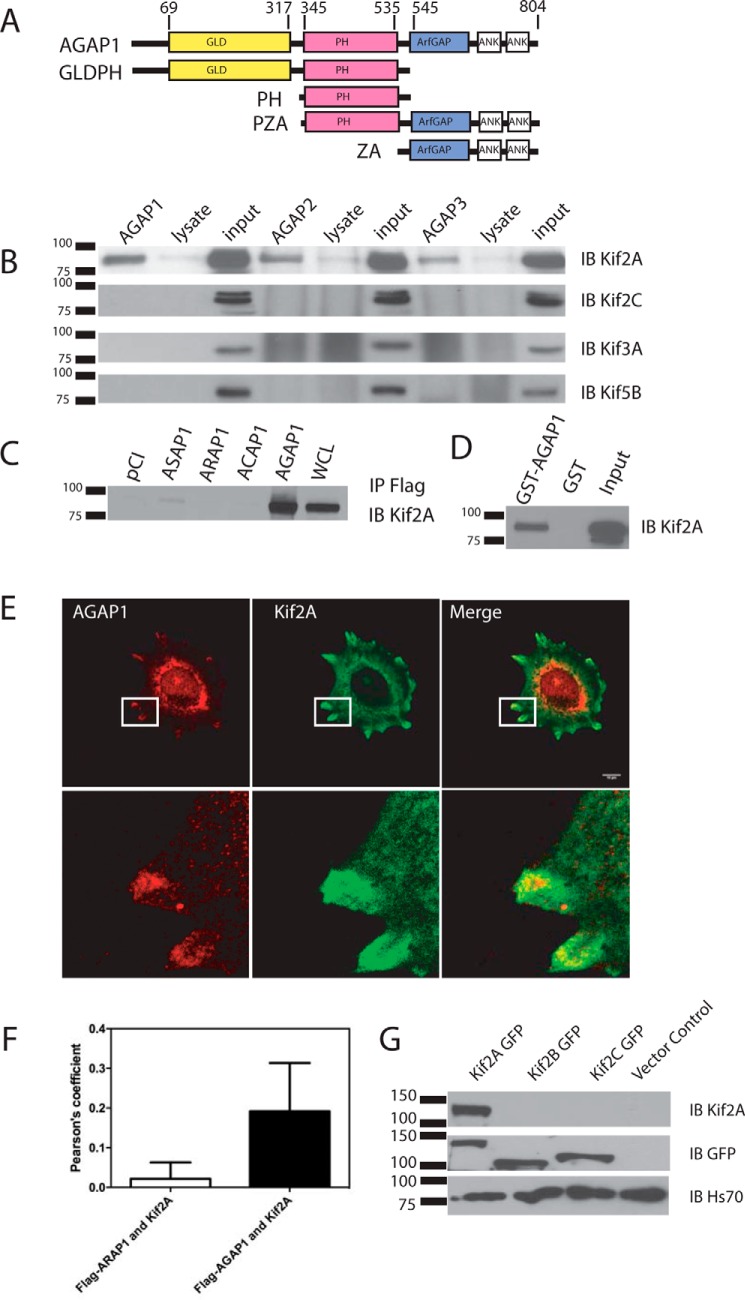
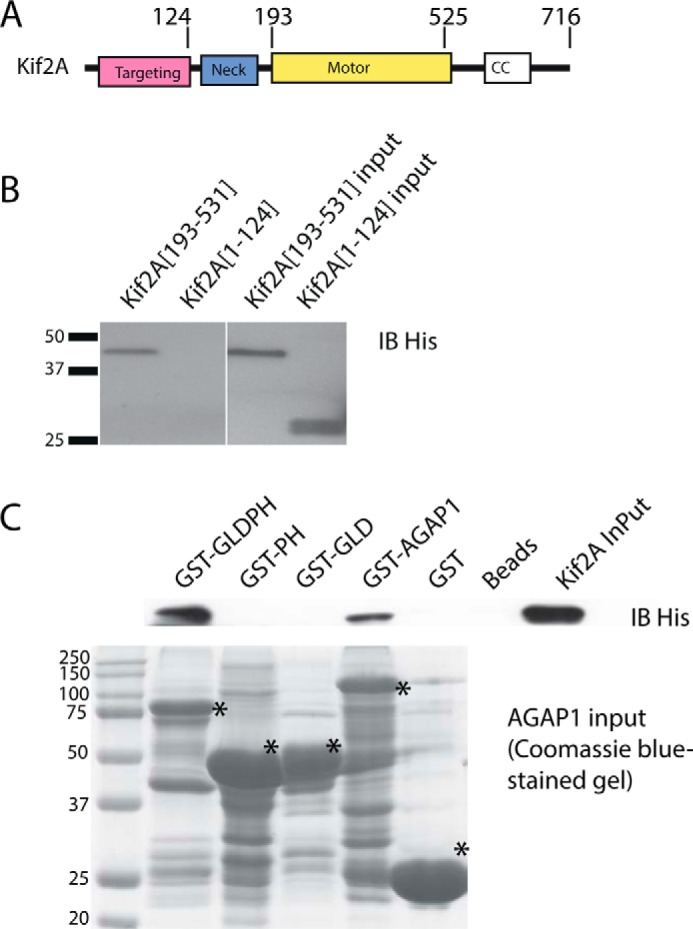
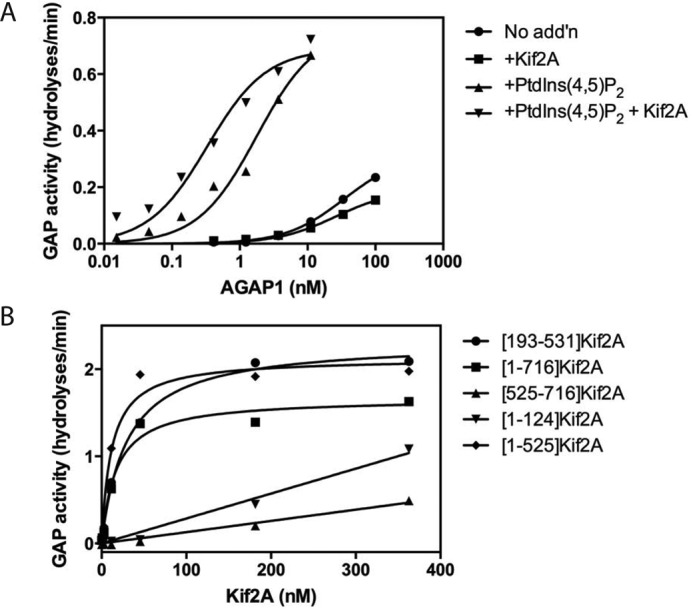
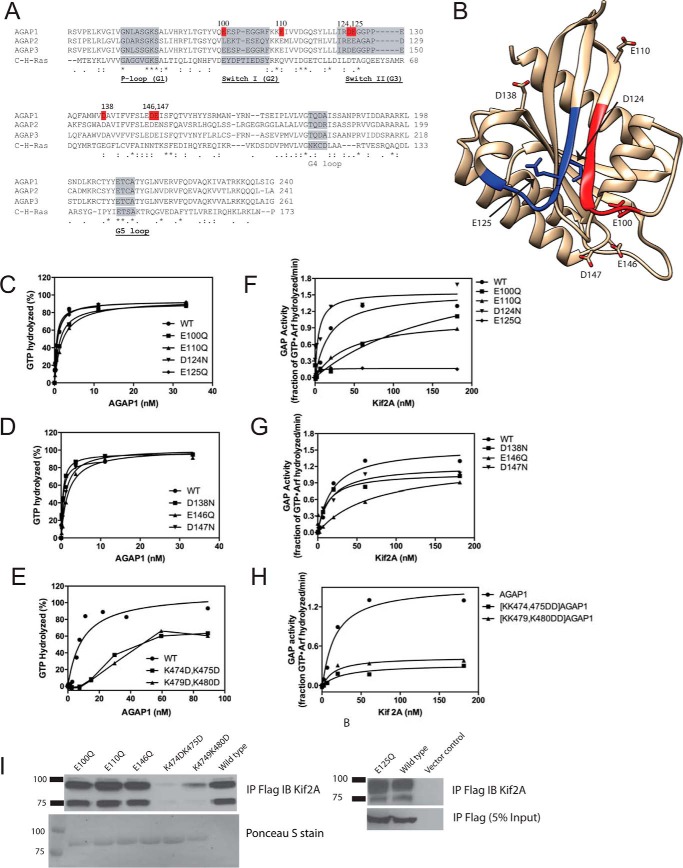
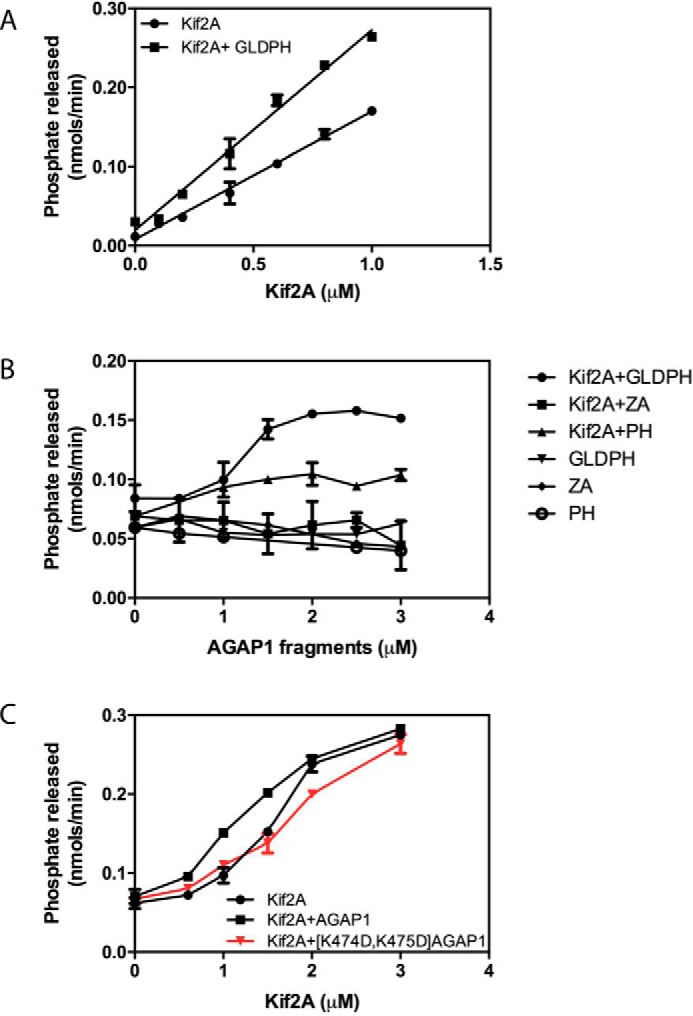
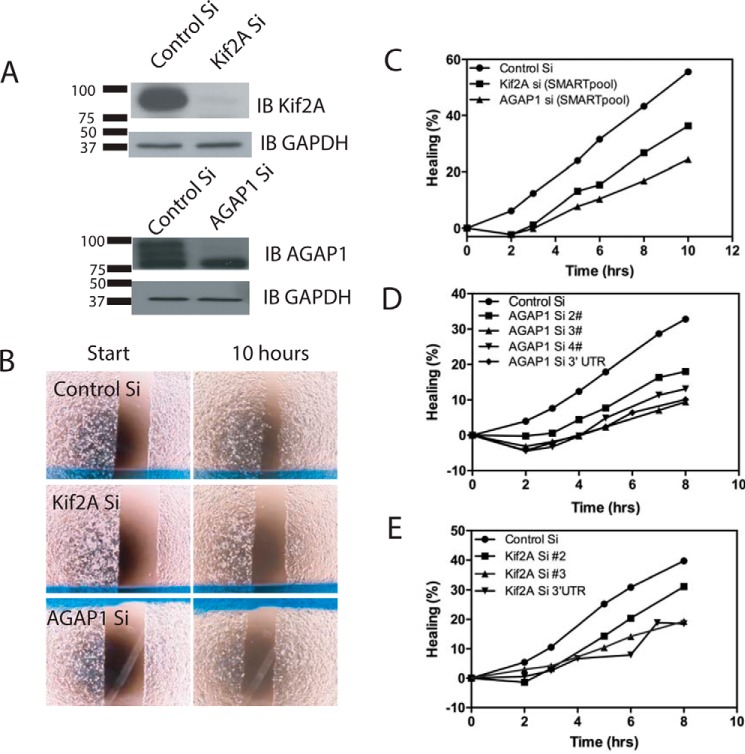
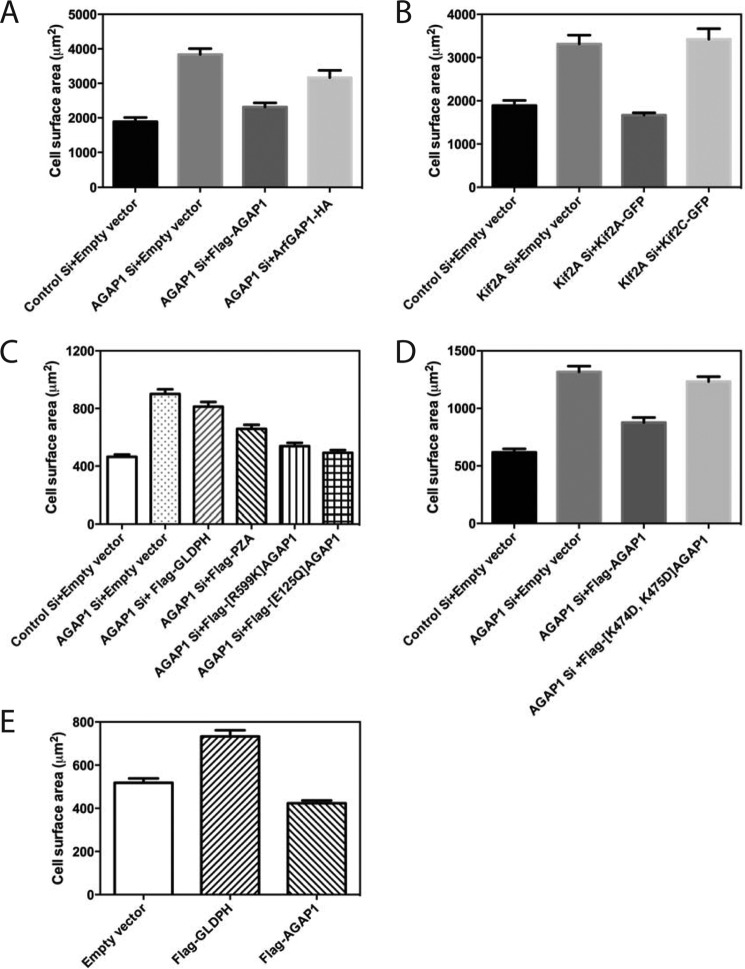
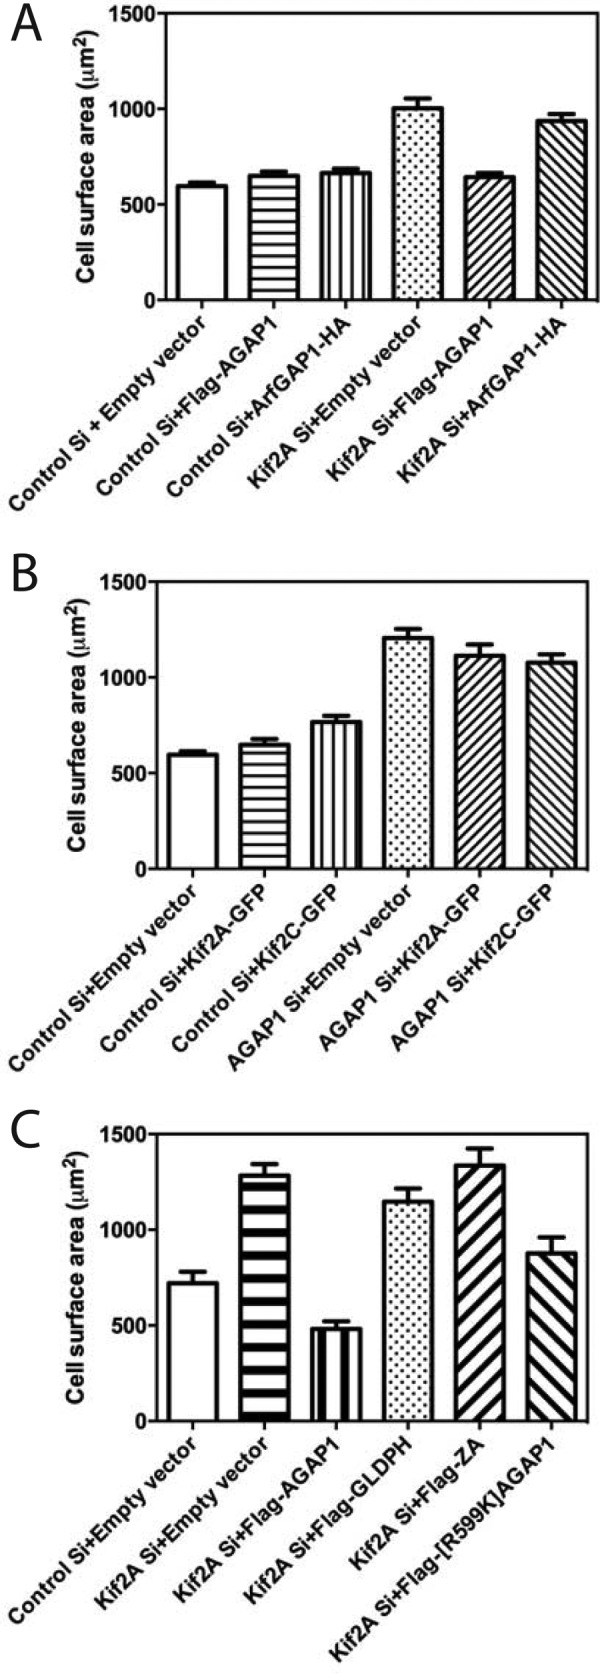
The molecular basis for control of the cytoskeleton by the Arf GTPase-activating protein AGAP1 has not been characterized. AGAP1 is composed of G-protein-like (GLD), pleckstrin homology (PH), Arf GAP, and ankyrin repeat domains. Kif2A was identified in screens for proteins that bind to AGAP1. The GLD and PH domains of AGAP1 bound the motor domain of Kif2A. Kif2A increased GAP activity of AGAP1, and a protein composed of the GLD and PH domains of AGAP1 increased ATPase activity of Kif2A. Knockdown (KD) of Kif2A or AGAP1 slowed cell migration and accelerated cell spreading. The effect of Kif2A KD on spreading could be rescued by expression of Kif2A-GFP or FLAG-AGAP1, but not by Kif2C-GFP. The effect of AGAP1 KD could be rescued by FLAG-AGAP1, but not by an AGAP1 mutant that did not bind Kif2A efficiently, ArfGAP1-HA or Kif2A-GFP. Taken together, the results support the hypothesis that the Kif2A·AGAP1 complex contributes to control of cytoskeleton remodeling involved in cell movement.

Keywords: ADP ribosylation factor (ARF); AGAP1; Arf GTPase-activating protein; GTPase activating protein (GAP); Kif2A; PH domain; cell biology; enzyme; kinesin; kinesin-13; protein complex; small GTPase.


Figures

FIGURE 1.
FIGURE 1.
Interaction between AGAP1 and Kif2A. A, schematic of the domain structure of AGAP1 and recombinant proteins. Ank, ankyrin repeat. B, coimmunoprecipitation of kinesins with FLAG-tagged AGAPs. HeLa cells were transfected with an empty pCI vector or pCI with cDNA for FLAG-AGAP1, FLAG-AGAP2, or myc-AGAP3. The cells were lysed after 24 h. Proteins from the lysates were immunoprecipitated with an antibody against the FLAG or myc epitope, and the precipitates were probed with an antibody against Kif2A, Kif2A, Kif3A, and Kif5B. IB, immunoblotting. C, association of GST-AGAP1 with Kif2A in a cell lysate. HeLa cell lysate was incubated with GST or GST-AGAP at 4 °C overnight. GST was precipitated with glutathione beads, and Kif2A was detected in the precipitates by immunoblotting using a polyclonal antibody against Kif2A. The total Hela cell lysate was included as a positive control. IP, immunoprecipitation. D, co-immunoprecipitation of Kif2A with four Arf GAP subtypes. HeLa cells were transfected with empty pCI vector or pCI with cDNA for FLAG-ASAP1, FLAG-ARAP1, FLAG-ACAP1, or FLAG-AGAP1. The cells were lysed after 24 h. Proteins from the lysates were immunoprecipitated with an antibody against the FLAG epitope. The precipitates were probed with an antibody against Kif2A. E, colocalization of FLAG-AGAP1 and endogenous Kif2A. Hela cells were transfected with FLAG-AGAP1 for 24 h. Cells were replated on fibronectin-coated coverslips in Opti-MEM for 6 h. The cells were fixed and stained using a monoclonal anti-FLAG antibody and a polyclonal rabbit anti-Kif2A serum. A 0.9-μm slice of the ventral surface is shown. F, quantification of colocalization of Kif2A with FLAG-AGAP1 and FLAG-ARAP1. Pearson's coefficients for Kif2A with either FLAG-AGAP1 or FLAG-ARAP1 in the periphery of the cells were determined for 30 cells (10 from each of 3 experiments). The data presented are the mean ± S.D. p < 0.0001 for FLAG-AGAP1-Kif2A. G, specificity of Kif2A antibody. Kif2A-GFP, Kif2B-GFP, and Kif2C-GFP were expressed in HeLa cells. The cell lysates were analyzed by immunoblotting using either the anti-Kif2A antibody and/or the anti-GFP antibody. Although all three proteins were expressed at similar levels, indicated by the signal with the anti-GFP antibody, signal was only observed with Kif2A when using the anti-Kif2A antibody.
FIGURE 2.
FIGURE 2.
Identification of sites of Kif2A·AGAP1 association. A, schematic of Kif2A. B, domain of Kif2A that binds to AGAP1. 100 nm His10-[193–531]Kif2A or His10-[1–124]Kif2A was incubated with 30 μg of GST-AGAP1. After an incubation at 37 °C for 30 min, glutathione beads were added and precipitated. The beads were washed with PBS three times, and the samples were separated on SDS-PAGE and immunoblotted (IB) with polyclonal anti-His antibody. C, domains of AGAP1 that are necessary and required for binding to Kif2A motor domain. 100 nm His10-[193–531]Kif2A was incubated with 30 μg of GST-GLDPH, GST-PH, GST-GLD, and GST-AGAP1 (see schematic in Fig. 1 for domains). GST and no GST were used as controls. After an incubation at 37 °C for 30 min, the glutathione beads were washed with PBS three times, and the samples were separated on SDS-PAGE and immunoblotted with polyclonal anti-Kif2A antibody. CC, coiled-coil; *, indicates position of the GST fusion protein.
FIGURE 3.
FIGURE 3.
Effect of Kif2A on AGAP1 activity. A, PtdIns(4,5)P2 and Kif2A cooperatively stimulate AGAP1 activity. 100 nm [193–531]Kif2A and 5 μm PtdIns(4,5)P2 were used in the GAP assay, which contained 0.5 μm myrArf1·[α32P]GTP, LUVs with PtdIns(4,5)P2 as indicated, and the indicated concentration of His-AGAP1. The reaction was followed by the conversion of [α32P]GTP to [α32P]GDP. No add'n, no addition. B, determination of the domain of Kif2A that stimulates AGAP1. The indicated His10-tagged fragments of Kif2A were titrated into reactions containing LUVs (same composition as panel A + PtdIns(4,5)P2), 1.1 nm AGAP1, and 0.5 μm myrArf1·[α32P]GTP. The reaction was followed by the conversion of [α32P]GTP to [α32P]GDP.
FIGURE 4.
FIGURE 4.
Effect of GLD of AGAP1 on GAP activity. A, sequence alignment of AGAP GLDs with H-Ras. Accession numbers are: AGAP1, gi:51338837; AGAP2, gi:6176569; AGAP3, gi:16799069; H-Ras, gi:231061. B, structure of AGAP3 GLD. The crystal structure of AGAP3 is shown with switch 1 colored red, switch 2 colored blue, and the residues aligning with the residues mutated in AGAP1 indicated. Protein Data Bank ID: 3IHW. C–E, activity of mutant AGAPs in the absence of Kif2A. The indicated AGAP1 mutants were titrated into a GAP reaction containing LUVs (same composition as in Fig. 3A, + PtdIns(4,5)P2), and 0.5 μm myrArf1·[α32P]GTP. F–H, effect of Kif2A on the activity of AGAP1 mutants. His10-[193–531]Kif2A was titrated in a reaction containing 0.5 μm myrArf1·[α32P]GTP, 500 μm LUVs (same composition as in Fig. 3A), and 1.0 nm of wild type AGAP1 or the indicated mutants. I, binding of mutant AGAP1 to Kif2A. FLAG-tagged wild type AGAP1 or the indicated mutants were expressed in HeLa cells. Cells were lysed, and the FLAG-tagged proteins were immunoprecipitated (IP) with an anti-FLAG antibody. Kif2A was detected in the precipitates by immunoblotting (IB) using an anti-Kif2A antibody. In the left panel, immunoprecipitated FLAG-tagged protein was detected by Ponceau S staining. In the right panel, immunoprecipitated FLAG-tagged protein was detected by immunoblotting for the FLAG epitope.
FIGURE 5.
FIGURE 5.
Effect of AGAP1 on Kif2A ATPase activity. A, titration of Kif2A with fixed GLDPH. Purified His10-[193–531]Kif2A was titrated into a 30-μl reaction containing 200 μm LUVs and 0.2 μg of microtubules with or without 1.0 μm of purified His10-GLDPH domain of AGAP1. The reactions were started by adding 0.3 mm ATP and stopped after 5 min. The data were analyzed by linear regression. The slope of Kif2A+GLDPH was greater than the slope of Kif2A alone, p < 0.001. B, titration of AGAP1 into a reaction with fixed Kif2A. The isolated His10-GLDPH of AGAP1 (the minimum binding domain), a recombinant protein composed of the Arf GAP and ankyrin repeats of AGAP1 fused to a 10-histidine tag (designated ZA in the figure, which does not bind to Kif2A), or the PH domain of AGAP1 was titrated into a reaction containing 200 μm LUVs, 0.2 μg of microtubules, and 0.7 μm His10-[191–531] Kif2A as indicated. Reactions were initiated by the addition of ATP and terminated after 5 min. Data were analyzed by two-way ANOVA. GLDPH increased Kif2A activity, p < 0.001; PH increased activity, p < 0.001; PH had less effect than GLDPH, p < 0.001; ZA had no significant effect. C, effect of mutation in the PH domain of AGAP1 on Kif2A ATPase activity. Purified His10-[193–531]Kif2A was titrated into a reaction mixture containing full-length AGAP1 or [K474D,K475D]AGAP1 as described for panel A. The data were analyzed by two-way ANOVA. AGAP1 plus Kif2A was greater than Kif2A alone, p < 0.001; [K474D,K475D]AGAP1 did not have a significant effect. Results shown are the mean ± S.E. from three independent experiments.
FIGURE 6.
FIGURE 6.
Effect of AGAP1 and Kif2A on cell migration. A, efficiency of Kif2A and AGAP1 KD. MDA-MB-231 cells were transfected with control siRNA (Control Si) or siRNA targeting either Kif2A or AGAP1 (SMARTpool siGENOME human siRNA from Dharmacon). Cell lysates were prepared 72 h later and analyzed by immunoblotting (IB) for Kif2A and AGAP1. B, wound healing assay. The effect of reduced expression of Kif2A or AGAP1, by siRNA treatment, on cell migration was examined using a wound healing assay using Ibidi wound healing assay chambers as described under “Materials and Methods.” A single time point from a representative experiment is presented. C, migration of cells with reduced expression of Kif2A and AGAP1. Migration of cells treated with SMARTpool siRNA targeting either Kif2A or AGAP1 was determined using the wound healing assay. Migration was quantified as described under “Materials and Methods.” D and E, effect of reduced AGAP1 or Kif2A expression on cell migration is independent of the specific siRNA. The experiment was conducted as described for Fig. 7C but using several different individual siRNA targeting AGAP1 (D) or Kif2A (E).
FIGURE 7.
FIGURE 7.
Effect of AGAP1 and Kif2A on cell spreading. A and B, reduced expression of endogenous AGAP1 or Kif2A and replacement with FLAG-AGAP1 and Kif2A-GFP. Hela cells treated with siRNA targeting noncoding regions on either AGAP1 or Kif2A and transfected with either empty plasmid or plasmids for expression of FLAG-AGAP1, Arf GAP1-HA, Kif2A-GFP, or Kif2C-GFP, as indicated, were plated on fibronectin-coated cover glass for 20 min. The area of rhodamine-phalloidin-stained cells was determined for at least 40 cells per condition using ImageJ version 1.46r. Results shown are the mean ± S.E. from three independent experiments. Differences were tested by ANOVA followed by multiple comparison post-tests using the program PrismTM. A, control Si versus AGAP1 Si + empty vector, p < 0.001; AGAP1 Si + empty vector versus AGAP1 Si + FLAG-AGAP1, p < 0.001; AGAP1 Si + empty vector versus AGAP1 Si + ArfGAP1-HA, p < 0.05. B, control Si + empty vector versus Kif2A Si + empty vector, p < 0.001; Kif2A Si + empty vector versus Kif2A Si + Kif2A GFP, p < 0.005; Kif2A Si + empty vector versus Kif2A Si + Kif2C-GFP, not significant. C, effect of expression of AGAP1 mutants on spreading of cells with reduced endogenous AGAP1. Hela cells treated with siRNA targeting the noncoding region of AGAP1 and transfected with plasmids for expression of the indicated fragments of AGAP1 or mutants of AGAP1 were plated on fibronectin-coated coverslips for 20 min, and cell surface area was determined as in A. Control Si + empty vector versus AGAP1 Si + empty vector, p < 0.001; AGAP1 Si + empty vector versus AGAP1 Si + FLAG-GLDPH, not significant; AGAP1 Si + empty vector versus AGAP1 Si + FLAG-PZA, + [R599K]AGAP1, + [E125Q]AGAP1, p < 0.001. AGAP1Si + PZA versus AGAP1Si + FLAG-[R599K]AGAP1, p < 0.001. D, effect of expression of FLAG-[K474D,K475D]AGAP1 on spreading of cells with reduced endogenous AGAP1 expression. The experiment is similar to that described in C except that FLAG-[K474D,K475D] AGAP1 was the only mutant examined. Control Si + empty vector versus AGAP1 Si + empty vector, p < 0.001; AGAP1 Si + empty vector versus AGAP1 Si + FLAG-AGAP1, p < 0.001; AGAP1 Si + empty vector versus AGAP1 Si + FLAG-[K474D,K475D]AGAP1, not significant. E, effect of overexpression of AGAP1 and GLDPH on spreading of cells. Spreading of cells transfected with empty vector (pCI) or plasmids for expression of FLAG-AGAP1 or FLAG-GLDPH was determined as in A. Empty vector versus FLAG-GLDPH, p < 0.001; empty vector versus FLAG-AGAP1, p < 0.01.
FIGURE 8.
FIGURE 8.
Effect of Kif2A-GFP overexpression on AGAP1 knockdown and effect of FLAG-AGAP1 overexpression on Kif2A knockdown. Spreading of HeLa cells treated with siRNA targeting the noncoding region of AGAP1 or Kif2A and transfected with plasmids for expression of either Kif2A-GFP, Kif2C-GFP, FLAG-AGAP1, or ArfGAP1-HA was determined, and data analysis was carried out as in Fig. 7. A, effect of AGAP1 overexpression on Kif2A knockdown. Control Si + empty vector versus Kif2A Si + empty vector, p < 0.001; Kif2A Si + empty vector versus Kif2A Si + FLAG-AGAP1, p < 0.001; Kif2A Si + empty vector + ArfGAP1-HA, not significant. B, effect of Kif2A-GFP or Kif2C-GFP overexpression of AGAP1 knockdown. Control Si + empty vector versus AGAP1 Si + empty vector, p < 0.001; AGAP1 Si + empty vector versus AGAP1 Si + Kif2A-GFP or AGAP1 Si + Kif2C-GFP, not significant. C, effect of AGAP1 and AGAP1 mutants on Kif2A knockdown. The results were analyzed by ANOVA with post-test multiple comparisons. Control Si + empty vector versus Kif2ASi + empty vector, p < 0.0001; control Si + empty vector versus Kif2ASi + FLAG-AGAP1, not significant; Kif2A Si +empty vector versus Kif2A Si + FLAG-AGAP1, p < 0.0001; Kif2A Si +empty vector versus Kif2A Si + FLAG-GLDPH, not significant; Kif2A Si +empty vector versus Kif2A Si + FLAG-ZA, not significant; Kif2A Si +empty vector versus Kif2A Si + FLAG-[R599K]AGAP, p < 0.01; Kif2A Si +FLAG-AGAP1 versus Kif2A Si + FLAG-[R599K]AGAP, p < 0.05. Results shown are the mean ± S.E. from three independent experiments.

Similar articles

Cited by

  • Arf GAPs and molecular motors.
    Luo R, Reed CE, Sload JA, Wordeman L, Randazzo PA, Chen PW. Luo R, et al. Small GTPases. 2019 May;10(3):196-209. doi: 10.1080/21541248.2017.1308850. Epub 2017 Apr 21. Small GTPases. 2019. PMID: 28430047 Free PMC article. Review.

References

    1. Kahn R. A., Bruford E., Inoue H., Logsdon J. M. Jr., Nie Z., Premont R. T., Randazzo P. A., Satake M., Theibert A. B., Zapp M. L., and Cassel D. (2008) Consensus nomenclature for the human ArfGAP domain-containing proteins. J. Cell Biol. 182, 1039–1044 - PMC - PubMed
    1. Randazzo P. A., Inoue H., and Bharti S. (2007) Arf GAPs as regulators of the actin cytoskeleton. Biol. Cell 99, 583–600 - PubMed
    1. Donaldson J. G., and Jackson C. L. (2011) ARF family G proteins and their regulators: roles in membrane transport, development and disease. Nat. Rev. Mol. Cell Biol. 12, 362–375; Correction (2011) Nat. Rev. Mol. Cell Biol.12, 533 - PMC - PubMed
    1. Kahn R. A., Cherfils J., Elias M., Lovering R. C., Munro S., and Schurmann A. (2006) Nomenclature for the human Arf family of GTP-binding proteins: ARF, ARL, and SAR proteins. J. Cell Biol. 172, 645–650 - PMC - PubMed
    1. Randazzo P. A., and Kahn R. A. (1994) GTP Hydrolysis by ADP-ribosylation factor is dependent on both an ADP-ribosylation factor GTPase-Activating protein and acid phospholipids. J. Biol. Chem. 269, 10758–10763 - PubMed

Associated data