. 2016 Sep:60:103-11.
doi: 10.1016/j.oraloncology.2016.07.002. Epub 2016 Jul 20.

'Cytology-on-a-chip' based sensors for monitoring of potentially malignant oral lesions

Affiliations

'Cytology-on-a-chip' based sensors for monitoring of potentially malignant oral lesions

Timothy J Abram et al. Oral Oncol. 2016 Sep.

Abstract

Despite significant advances in surgical procedures and treatment, long-term prognosis for patients with oral cancer remains poor, with survival rates among the lowest of major cancers. Better methods are desperately needed to identify potential malignancies early when treatments are more effective.

Objective: To develop robust classification models from cytology-on-a-chip measurements that mirror diagnostic performance of gold standard approach involving tissue biopsy.

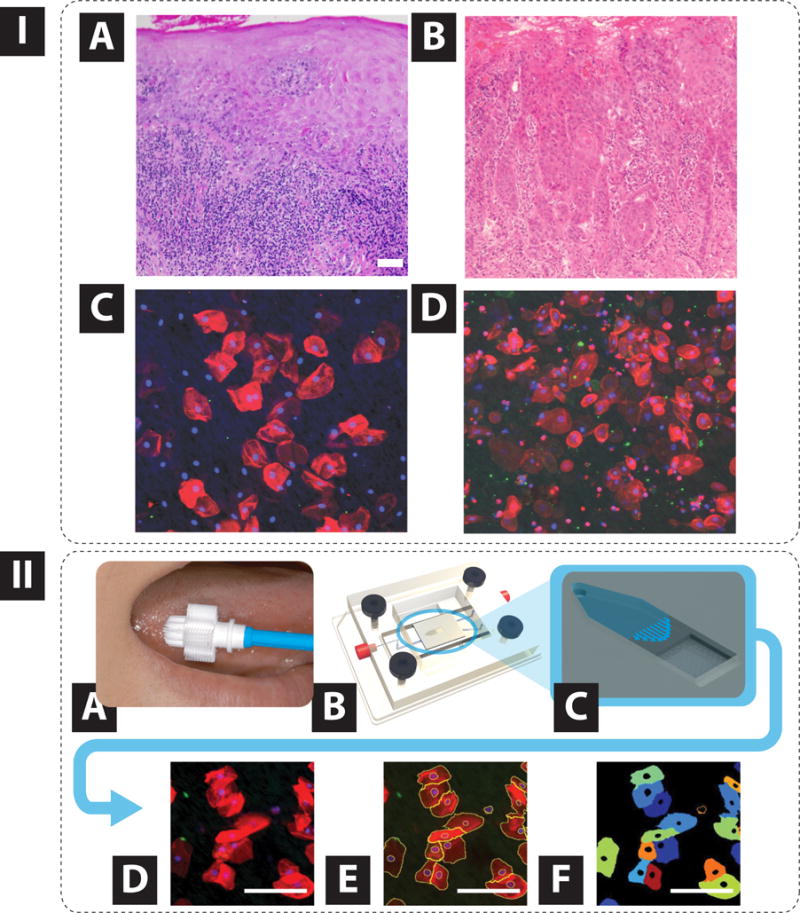
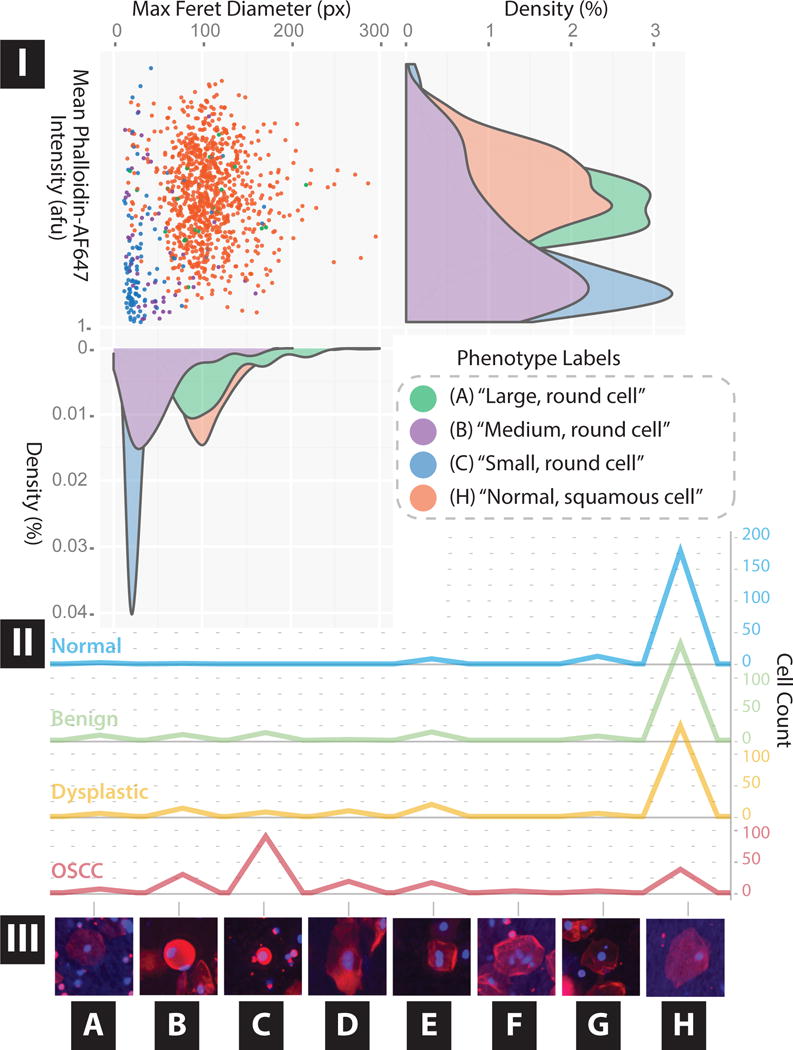
Materials and methods: Measurements were recorded from 714 prospectively recruited patients with suspicious lesions across 6 diagnostic categories (each confirmed by tissue biopsy -histopathology) using a powerful new 'cytology-on-a-chip' approach capable of executing high content analysis at a single cell level. Over 200 cellular features related to biomarker expression, nuclear parameters and cellular morphology were recorded per cell. By cataloging an average of 2000 cells per patient, these efforts resulted in nearly 13 million indexed objects.

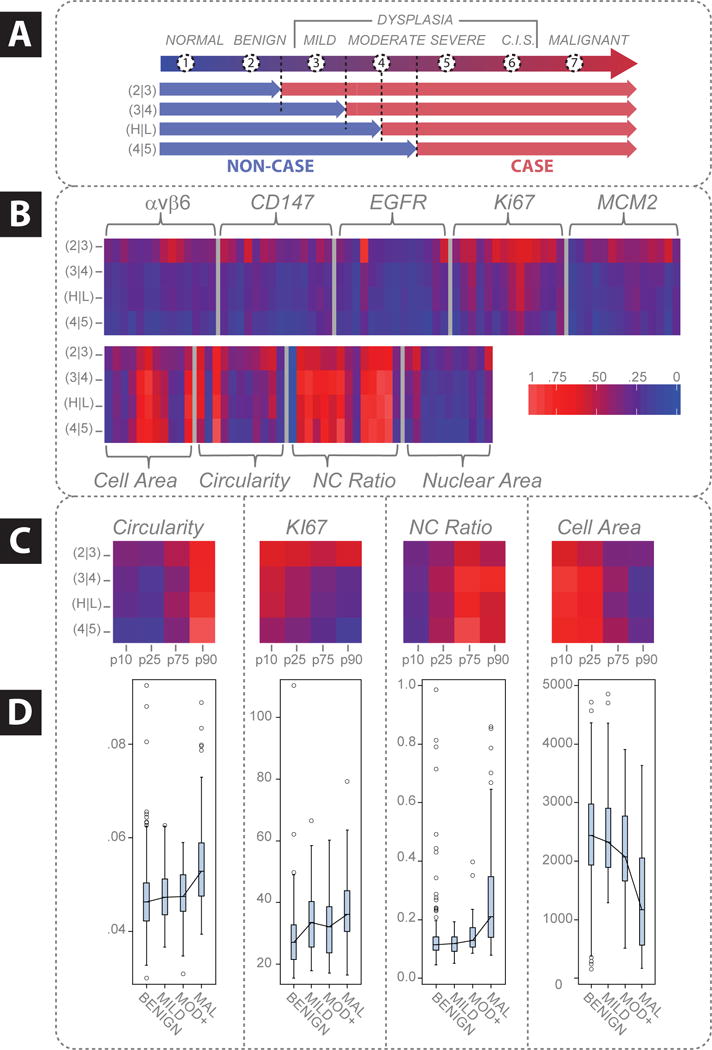
Results: Binary "low-risk"/"high-risk" models yielded AUC values of 0.88 and 0.84 for training and validation models, respectively, with an accompanying difference in sensitivity+specificity of 6.2%. In terms of accuracy, this model accurately predicted the correct diagnosis approximately 70% of the time, compared to the 69% initial agreement rate of the pool of expert pathologists. Key parameters identified in these models included cell circularity, Ki67 and EGFR expression, nuclear-cytoplasmic ratio, nuclear area, and cell area.

Conclusions: This chip-based approach yields objective data that can be leveraged for diagnosis and management of patients with PMOL as well as uncovering new molecular-level insights behind cytological differences across the OED spectrum.

Keywords: Cytology; High content analysis; LASSO; Machine learning; Microfluidic; Oral cancer; Oral epithelial dysplasia; Random forest.


Conflict of interest statement

Principal Investigator, John T. McDevitt, has an equity interest in SensoDX, LLC. and also serves on their Scientific Advisory Board. The terms of this arrangement have been reviewed and approved by New York University in accordance with its conflict of interest policies.

Figures

Figure 1
Figure 1. Diagram of cytology-on-a-chip processing and sample images
Panel I.) Representative histopathological (H&E staining) images (A–B) and immunofluorescence-cytology images (C–D) for 4 different patients. (A, C) are derived from Benign (Fig. 1.I.A = lichen planus diagnosis) and (B, D) from OSCC diagnoses as confirmed from independent agreement between two reviewing pathologists. Scale bars for A, B, C, and D = 100 μm. Panel II.) Diagram of “cytology-on-chip” sample processing in which a brush cytology sample is collected (A), processed in a suspension, and delivered through the microfluidic platform (B) to a cell-capture, nano-porous membrane (C). Multi-spectral fluorescence images are recorded (D) and analyzed with automated software to identify single cells (E) and extract these regions for measurement (F).
Figure 2
Figure 2. Variable importance from Random Forest models
A) Visual representation of diagnostic spectrum and the 4 diagnostic splits used in this trial to dichotomize diagnoses into either “Case” or “Non-case”. B) Univariate heat map of Gini values resulting from Random Forest modeling to demonstrate variable importance across all 4 diagnostic splits (y axis). Gini values from each model were scaled between 0 and 1 to generalize relative variable importance across all models. A value of 1 implies the variable is better able to discriminate between “case” and “non-case” than a variable with a value closer to 0. Groups of parameters are labeled by their corresponding marker; single boxes represent specific summary measures (see Supplementary Figure 2 for more detailed labeling). Heatmaps should not be interpreted as “expression”, but rather as the information content associated with each parameter in its ability to differentiate between “case” and “non-case”. C) Parameter subset from (B) to focus on summary percentile measurements (p10, p25, p50, p75, p90 = 10th, 25th, 50th, 75th, 90th percentile values). D) Box-and-whisker plots showing the distribution of median values for Circularity (unit-less value between 0 and 1), Ki67 (units = arbitrary fluorescence units (afu), nuclear-to-cytoplasmic (NC) ratio (unit-less ratio), and Cell Area (units = px2), respectively. The box bottom and top represent the 25th and 75th percentiles, respectively. Median values are connected between boxes, and whiskers down/up to 1.5 interquartile range. (Ben = “benign”, Mild = “mild dysplasia”, Mod+ = “moderate/severe/CIS dysplasia”, Mal = “malignant”).
Figure 3
Figure 3. Chord Diagram of LASSO model parameter odds-ratios
Chord width refers to the relative contribution of a particular variable, based on standardized odds-ratios, calculated by exponentiating individual parameter coefficients from the logistic regression models. Odds-ratios of single parameters represent the odds that a model will predict the “Case” diagnosis for an increase of one standard deviation for the standardized (unit-less) parameter while holding all other parameters constant. Model splits are identified on the right side and their corresponding variables on the left side. Parameters are further color-coordinated by categorical grouping: Lesion characteristics (L. Size = Lesion Size, L. Color = Lesion Color, LP = presence of the clinical features of lichen planus), Nuclear parameters (NC = NC-ratio, Nuc Area = nuclear area), Biomarkers (αvβ6, CD147, EGFR, Ki67, MCM2), and Cytomorphometric parameters (circularity, cell area). Summary statistic measures include A: coefficient of variation, B: variance, C: median, D: 10th percentile, E: 25th percentile, F: 75th percentile, G: 90th percentile, H: skewness, I: standard deviation, J: >0.5 Z-Score, K: >2.0 Z-Score, L: short-axis, M: long-axis, *: Log-scale, 2:squared
Figure 4
Figure 4. Cellular Phenotype Identified by Morphometric Parameters
Panel I) Scatterplot and density histograms for two morphometric parameters (Maximum Feret diameter and mean Phalloidin intensity) used to distinguish sub-populations of cells. Panel II) Bar plot of cell counts for each of the phenotypes identified by Panel III for 300 randomly selected cells from patients with final adjudicated diagnoses in categories “Normal”, “Benign”, “Dysplastic” (including mild, moderate, severe dysplasia and CIS), and “OSCC”. These plots are visualized as a continuous line where peaks refer to the number of cells identified in each case in order to illustrate a “phenotype fingerprint” of the disease categories. Panel III) Representative images of unique cellular phenotypes identified by significant differences in key morphometric parameters. Each thumbnail is cropped to the same dimensions of 120 μm ×120 μm. Phenotypic categories included A) Cells with smooth cytoplasmic border and high circularity, but low NC-ratio, B) Cells with high circularity, high NC-ratio, and medium cytoplasm area, C) Cells with high circularity, high N-C ratio, and small cytoplasm area, D) large cells with enlarged nuclei, E) Binucleated cells, F) Polynucleated cells, G) Cells with micronuclei, and H) Normal appearing squamous cells.

Similar articles

Cited by

References

    1. Shulman JD, Beach MM, Rivera-Hidalgo F. The prevalence of oral mucosal lesions in U.S. adults: Data from the Third National Health and Nutrition Examination Survey, 1988–1994. J Am Dent Assoc. 2004;135:1279–86. - PubMed
    1. Lee JJ, Hong WK, Hittelman WN, Mao L, Lotan R, Shin DM, et al. Predicting cancer development in oral leukoplakia: Ten years of translational research. Clin Cancer Res. 2000;6:1702–10. - PubMed
    1. Napier SS, Speight PM. Natural history of potentially malignant oral lesions and conditions: An overview of the literature. J Oral Pathol Med. 2008;37:1–10. doi: 10.1111/j.1600-0714.2007.00579.x. - DOI - PubMed
    1. Lydiatt DD. Cancer of the oral cavity and medical malpractice. Laryngoscope. 2002;112:816–9. - PubMed
    1. Holmstrup P, Vedtofte P, Reibel J, Stoltze K. Long-term treatment outcome of oral premalignant lesions. Oral Oncol. 2006;42:461–74. doi: 10.1016/j.oraloncology.2005.08.011. - DOI - PubMed

Publication types