

Disease Severity and Immune Activity Relate to Distinct Interkingdom Gut Microbiome States in Ethnically Distinct Ulcerative Colitis Patients
- PMID: 27531910
- PMCID: PMC4992973
- DOI: 10.1128/mBio.01072-16
Disease Severity and Immune Activity Relate to Distinct Interkingdom Gut Microbiome States in Ethnically Distinct Ulcerative Colitis Patients
Abstract
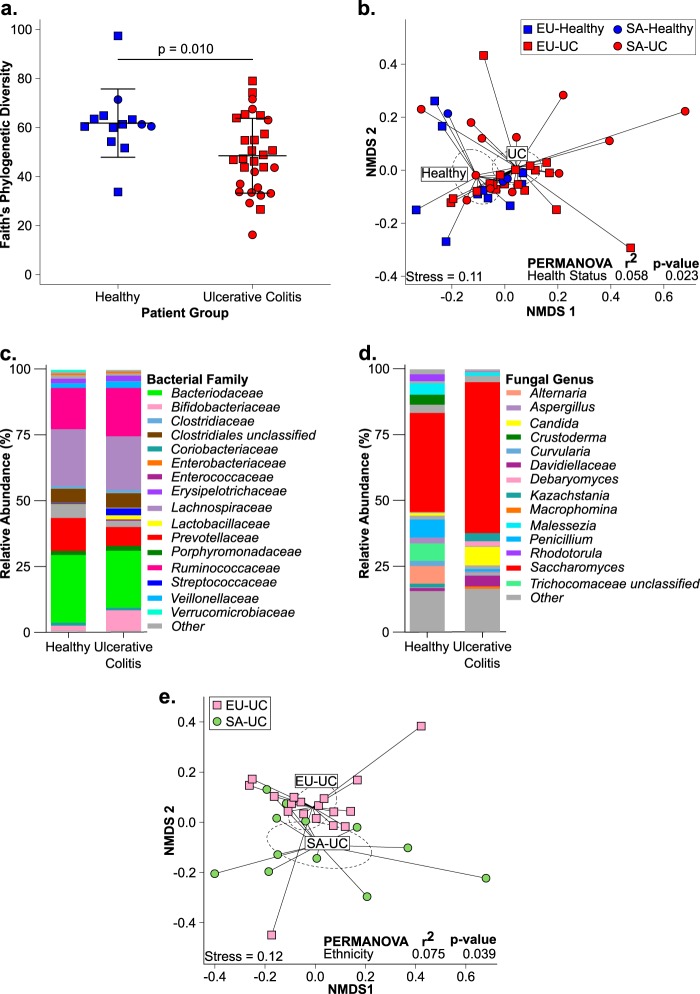
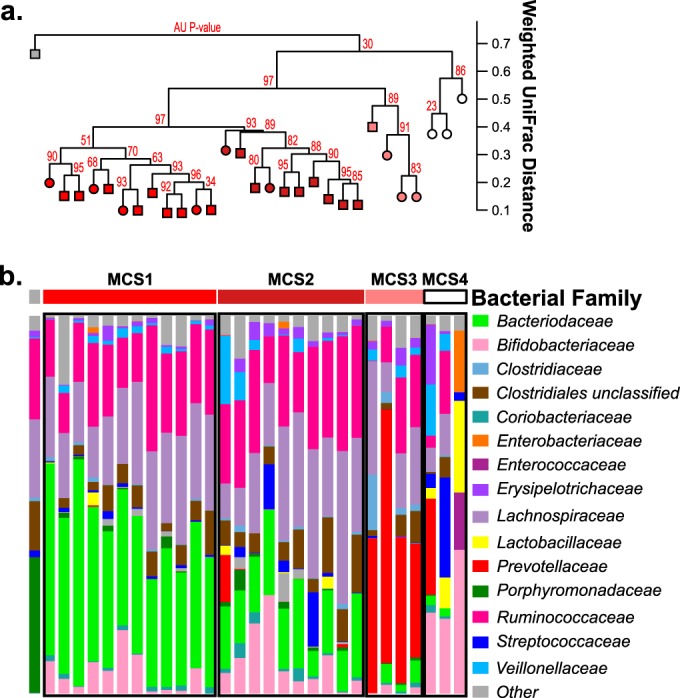
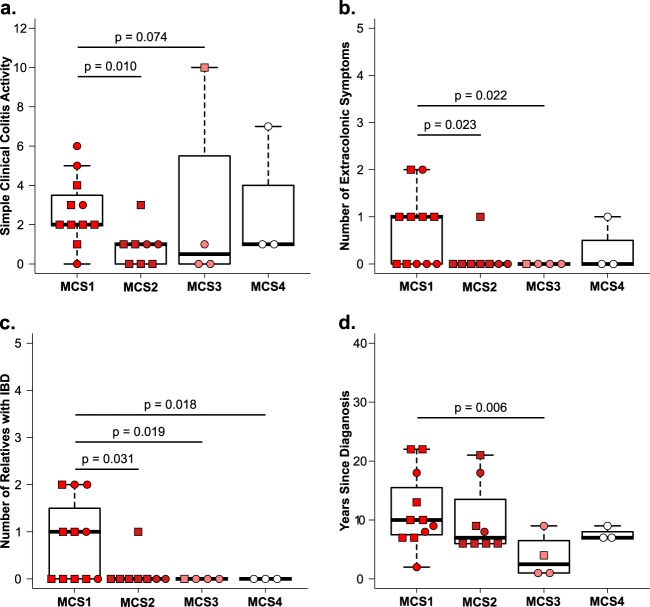
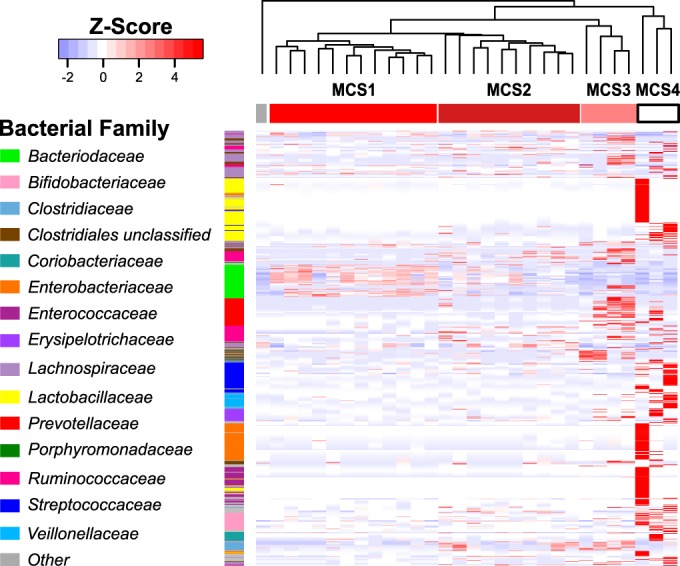
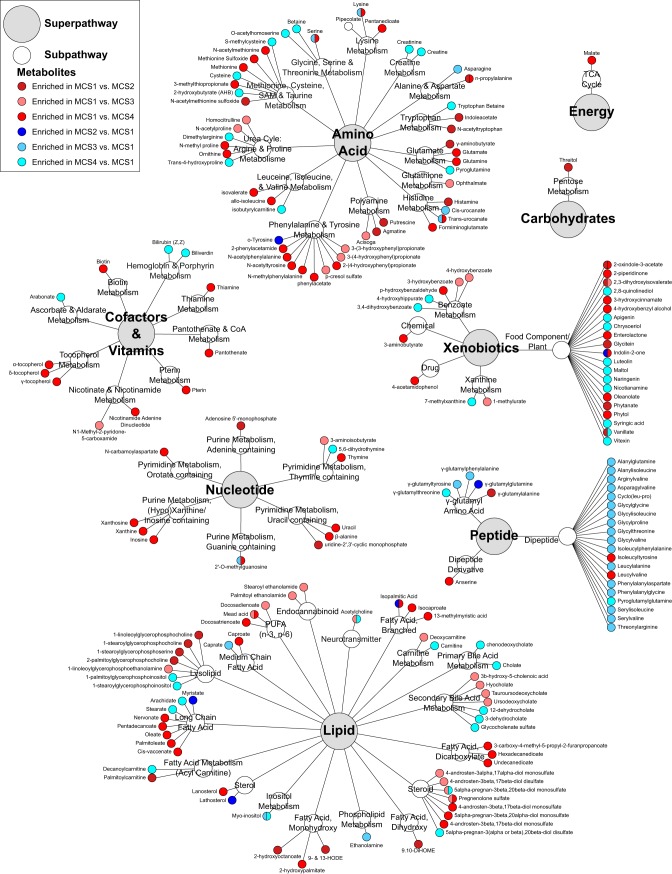
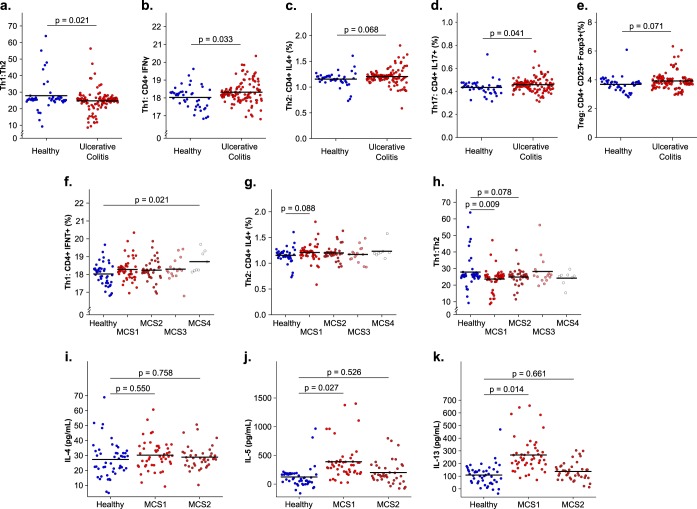
Significant gut microbiota heterogeneity exists among ulcerative colitis (UC) patients, though the clinical implications of this variance are unknown. We hypothesized that ethnically distinct UC patients exhibit discrete gut microbiotas with unique metabolic programming that differentially influence immune activity and clinical status. Using parallel 16S rRNA and internal transcribed spacer 2 sequencing of fecal samples (UC, 30; healthy, 13), we corroborated previous observations of UC-associated bacterial diversity depletion and demonstrated significant Saccharomycetales expansion as characteristic of UC gut dysbiosis. Furthermore, we identified four distinct microbial community states (MCSs) within our cohort, confirmed their existence in an independent UC cohort, and demonstrated their coassociation with both patient ethnicity and disease severity. Each MCS was uniquely enriched for specific amino acid, carbohydrate, and lipid metabolism pathways and exhibited significant luminal enrichment of the metabolic products of these pathways. Using a novel ex vivo human dendritic cell and T-cell coculture assay, we showed that exposure to fecal water from UC patients caused significant Th2 skewing in CD4(+) T-cell populations compared to that of healthy participants. In addition, fecal water from patients in whom their MCS was associated with the highest level of disease severity induced the most dramatic Th2 skewing. Combined with future investigations, these observations could lead to the identification of highly resolved UC subsets based on defined microbial gradients or discrete microbial features that may be exploited for the development of novel, more effective therapies.
Importance: Despite years of research, the etiology of UC remains enigmatic. Diagnosis is difficult and the patient population heterogeneous, which represents a significant barrier to the development of more effective, tailored therapy. In this study, we demonstrate the clinical utility of the gut microbiome in stratifying UC patients by identifying the existence of four distinct interkingdom pathogenic microbiotas within the UC patient population that are compositionally and metabolically distinct, covary with clinical markers of disease severity, and drive discrete CD4(+) T-cell expansions ex vivo These findings offer new insight into the potential value of the gut microbiome as a tool for subdividing UC patients, opening avenues to the development of more personalized treatment plans and targeted therapies.
Copyright © 2016 Mar et al.
Figures
References
-
- Yatsunenko T, Rey FE, Manary MJ, Trehan I, Dominguez-Bello MG, Contreras M, Magris M, Hidalgo G, Baldassano RN, Anokhin AP, Heath AC, Warner B, Reeder J, Kuczynski J, Caporaso JG, Lozupone CA, Lauber C, Clemente JC, Knights D, Knight R, Gordon JI. 2012. Human gut microbiome viewed across age and geography. Nature 486:222–227. doi:10.1038/nature11053. - DOI - PMC - PubMed
-
- Frank DN, Robertson CE, Hamm CM, Kpadeh Z, Zhang T, Chen H, Zhu W, Sartor RB, Boedeker EC, Harpaz N, Pace NR, Li E. 2011. Disease phenotype and genotype are associated with shifts in intestinal-associated microbiota in inflammatory bowel diseases. Inflamm Bowel Dis 17:179–184. doi:10.1002/ibd.21339. - DOI - PMC - PubMed
MeSH terms
Substances
Grants and funding
LinkOut - more resources
Full Text Sources
Other Literature Sources
Medical
Molecular Biology Databases
Research Materials
