. 2016 Aug 10;2(8):e1600560.
doi: 10.1126/sciadv.1600560. eCollection 2016 Aug.

In-airway molecular flow sensing: A new technology for continuous, noninvasive monitoring of oxygen consumption in critical care

Affiliations

In-airway molecular flow sensing: A new technology for continuous, noninvasive monitoring of oxygen consumption in critical care

Luca Ciaffoni et al. Sci Adv. .

Abstract

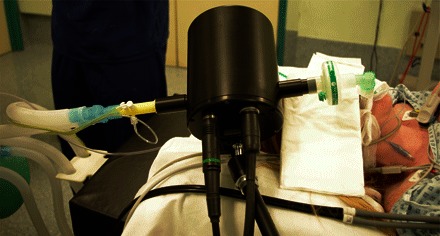
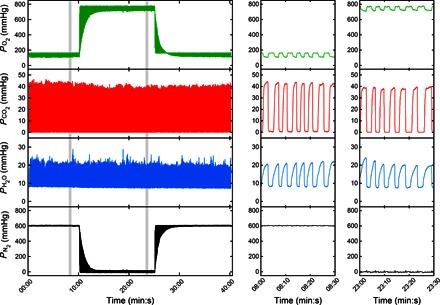
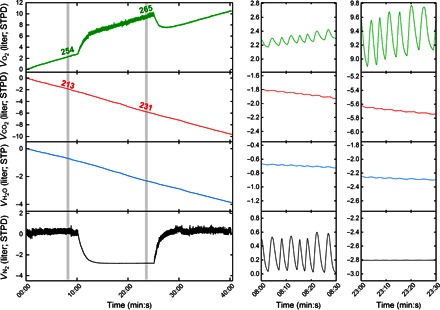
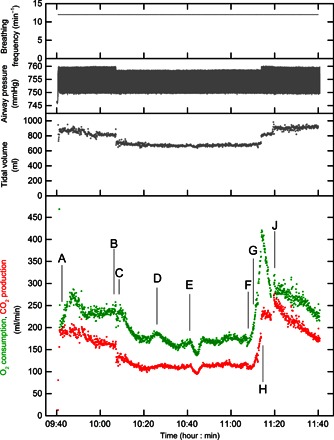
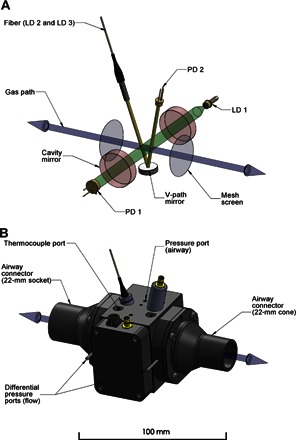
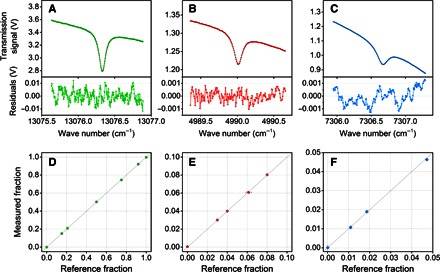
There are no satisfactory methods for monitoring oxygen consumption in critical care. To address this, we adapted laser absorption spectroscopy to provide measurements of O2, CO2, and water vapor within the airway every 10 ms. The analyzer is integrated within a novel respiratory flow meter that is an order of magnitude more precise than other flow meters. Such precision, coupled with the accurate alignment of gas concentrations with respiratory flow, makes possible the determination of O2 consumption by direct integration over time of the product of O2 concentration and flow. The precision is illustrated by integrating the balance gas (N2 plus Ar) flow and showing that this exchange was near zero. Measured O2 consumption changed by <5% between air and O2 breathing. Clinical capability was illustrated by recording O2 consumption during an aortic aneurysm repair. This device now makes easy, accurate, and noninvasive measurement of O2 consumption for intubated patients in critical care possible.

Keywords: Gas lasers; absorbence spectroscopy; gas exchange; laser spectroscopy; medical device; medical technology; oxygen consumption; respiration.


Figures

Fig. 1
Fig. 1. MFS in use during surgery.
MFS measurement head incorporated in a closed-loop anesthetic delivery system. A 5-m-long pair of cables connects the measurement head to the control unit located away from the operating table.
Fig. 2
Fig. 2. Partial pressures for the airway gases during an O2 wash-in and wash-out experiment.
A volunteer was initially asked to breathe laboratory air flowing pass the exhaust side of the MFS through a Y-piece connector. The gas mixture was delivered at approximately 100 liters/min to ensure that no rebreathing of expired gas would take place. After 10 min of stable breathing, the inspired gas was switched from air to medical-grade O2 (>99.5%). Approximately 15 min were allowed for the nitrogen to be fully washed out from the lungs, and then the gas supply was switched back to air. Right panels show expanded versions of the data at times indicated in the main panel to illustrate intrabreath morphology.
Fig. 3
Fig. 3. Results from direct integration over time to calculate cumulative gas exchange during an O2 wash-in and wash-out experiment.
Left panel shows the data over the whole time period, and expanded time scales are shown in the two panels to the right. The slopes give the rate of gas uptake (negative in the case of CO2 and H2O). Values are given in ml/min above the shaded regions. Right panels show the scaling of the ordinate axes that have been kept the same to illustrate the relative contributions of each gas species to tidal volume. Note that, apart from the periods of washing N2 out of or into the lung, the overall slope of the N2 volume plot is close to zero, illustrating the precision of the measurements. STPD, standard temperature and pressure, dry.
Fig. 4
Fig. 4. Gas exchange measurements during repair of an abdominal aortic aneurysm.
Breathing frequency, airway pressure, tidal volume, oxygen consumption, and carbon dioxide production during elective repair of an abdominal aortic aneurysm. Oxygen consumption and carbon dioxide production are shown breath-by-breath, rather than as the continuous integral of Fig. 3. Events are represented by points as follows: (A) knife to skin; (B) reduction in ventilator driving pressure; (C) aortic clamp applied; (D) fall in blood pressure; (E) metaraminol (fast-acting α-agonist) bolus, and infusion rate increased from 2 to 5 ml/hour; (F) and (G) sequential removal of iliac artery clamps; (H) increase in ventilator driving pressure; and (J) removal of superior retractor restricting rib cage movement.
Fig. 5
Fig. 5. Design of the MFS measurement head.
(A) Simplified diagram of the multichannel absorption spectrometer and the pneumotachograph contained within the measurement head. The bidirectional gas path (blue) is shown along with the two mesh screens (gray), across which the pressure drop related to the respiratory flow is measured. Radiation from the 764-nm diode laser (LD 1) used for probing oxygen is injected into an optical cavity constructed from a pair of highly reflective mirrors (red) and collected by a photodiode (PD 1) positioned along the optical axis (green). Two diode lasers, LD 2 and LD 3, located in the drive unit are used to probe for carbon dioxide and water vapor at 2004 and 1368 nm, respectively. Their outputs are spatially combined by a fiber-optic multiplexer located in the drive unit and are transmitted through a hybrid cable into the measurement cell. A fiber-optic collimator launches the radiation into the V path (yellow) and onto the photodiode (PD 2) via a concave mirror. (B) Three-dimensional CAD model of the measurement cell. The differential pressure ports located on the outer sides of the mesh screens are shown, together with the ports for the thermocouple probe and airway pressure sensor.
Fig. 6
Fig. 6. Characterization of the multichannel laser spectrometer.
(A to C) Examples of transmission spectra associated with the spectral transitions of oxygen (green), carbon dioxide (red), and water vapor (blue). The spectrum measured by each spectrometric channel (colored symbols) is fitted to a predicted model (black line) by multiple linear regression analysis to retrieve the molecular concentration. The overall acquisition and processing time is within 10 ms. Residuals from the fitted model are shown in the subplots. (D to F) Calibration curves for the three spectrometric channels generated by a constant flow (50 liters/min) of pure gases and various calibration gas mixtures. The experimentally measured gas fractions are shown as symbols, with error bars in the x and y axes representing the absolute uncertainty (±1σ) in the composition of the gravimetrically prepared mixtures and in the output of the gas analyzer, respectively. For most data points, the error bars are contained within the size of the symbols. The line of identity is shown for reference.

References

    1. Black C., Grocott M. P. W., Singer M., Metabolic monitoring in the intensive care unit: A comparison of the Medgraphics Ultima, Deltatrac II, and Douglas bag collection methods. Br. J. Anaesth. 114, 261–268 (2015). - PubMed
    1. Robinson P. D., Latzin P., Verbanck S., Hall G. L., Horsley A., Gappa M., Thamrin C., Arets H. G. M., Aurora P., Fuchs S. I., King G. G., Lum S., Macleod K., Paiva M., Pillow J. J., Ranganathan S., Ranganathan S., Ratjen F., Singer F., Sonnappa S., Stocks J., Subbarao P., Thompson B. R., Gustafsson P. M., Consensus statement for inert gas washout measurement using multiple- and single- breath tests. Eur. Respir. J. 41, 507–522 (2013). - PubMed
    1. Cummings B., Hamilton M. L., Ciaffoni L., Pragnell T. R., Peverall R., Ritchie G. A. D., Hancock G., Robbins P. A., Laser-based absorption spectroscopy as a technique for rapid in-line analysis of respired gas concentrations of O2 and CO2. J. Appl. Physiol. 111, 303–307 (2011). - PMC - PubMed
    1. Arieli R., Mass spectrometer for respiratory research. Respir. Physiol. Neurobiol. 170, 183–184 (2010). - PubMed
    1. Finucane K. E., Egan B. A., Dawson S. V., Linearity and frequency response of pneumotachographs. J. Appl. Physiol. 32, 121–126 (1972). - PubMed

Publication types