

LPEseq: Local-Pooled-Error Test for RNA Sequencing Experiments with a Small Number of Replicates
- PMID: 27532300
- PMCID: PMC4988759
- DOI: 10.1371/journal.pone.0159182
LPEseq: Local-Pooled-Error Test for RNA Sequencing Experiments with a Small Number of Replicates
Abstract
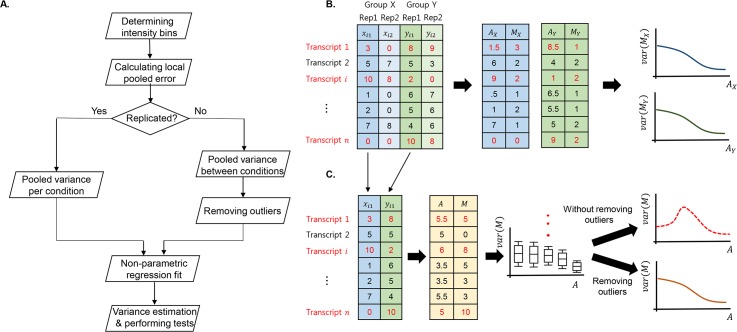
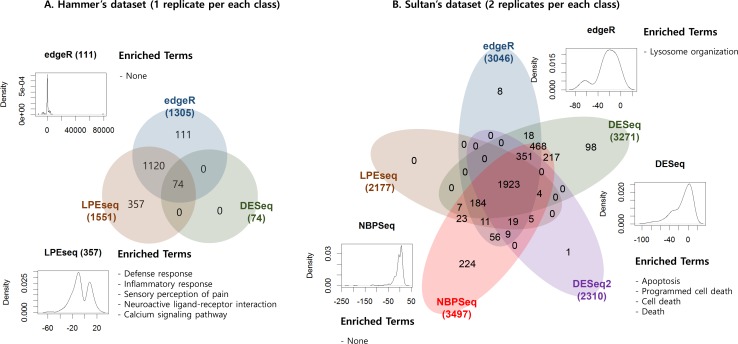
RNA-Sequencing (RNA-Seq) provides valuable information for characterizing the molecular nature of the cells, in particular, identification of differentially expressed transcripts on a genome-wide scale. Unfortunately, cost and limited specimen availability often lead to studies with small sample sizes, and hypothesis testing on differential expression between classes with a small number of samples is generally limited. The problem is especially challenging when only one sample per each class exists. In this case, only a few methods among many that have been developed are applicable for identifying differentially expressed transcripts. Thus, the aim of this study was to develop a method able to accurately test differential expression with a limited number of samples, in particular non-replicated samples. We propose a local-pooled-error method for RNA-Seq data (LPEseq) to account for non-replicated samples in the analysis of differential expression. Our LPEseq method extends the existing LPE method, which was proposed for microarray data, to allow examination of non-replicated RNA-Seq experiments. We demonstrated the validity of the LPEseq method using both real and simulated datasets. By comparing the results obtained using the LPEseq method with those obtained from other methods, we found that the LPEseq method outperformed the others for non-replicated datasets, and showed a similar performance with replicated samples; LPEseq consistently showed high true discovery rate while not increasing the rate of false positives regardless of the number of samples. Our proposed LPEseq method can be effectively used to conduct differential expression analysis as a preliminary design step or for investigation of a rare specimen, for which a limited number of samples is available.
Conflict of interest statement
Figures
Similar articles
-
Differential expression analysis of RNA sequencing data by incorporating non-exonic mapped reads.BMC Genomics. 2015;16 Suppl 7(Suppl 7):S14. doi: 10.1186/1471-2164-16-S7-S14. Epub 2015 Jun 11. BMC Genomics. 2015. PMID: 26099631 Free PMC article.
-
Statistical detection of differentially expressed genes based on RNA-seq: from biological to phylogenetic replicates.Brief Bioinform. 2016 Mar;17(2):243-8. doi: 10.1093/bib/bbv035. Epub 2015 Jun 24. Brief Bioinform. 2016. PMID: 26108230 Review.
-
A comparison of per sample global scaling and per gene normalization methods for differential expression analysis of RNA-seq data.PLoS One. 2017 May 1;12(5):e0176185. doi: 10.1371/journal.pone.0176185. eCollection 2017. PLoS One. 2017. PMID: 28459823 Free PMC article.
-
A multitask clustering approach for single-cell RNA-seq analysis in Recessive Dystrophic Epidermolysis Bullosa.PLoS Comput Biol. 2018 Apr 9;14(4):e1006053. doi: 10.1371/journal.pcbi.1006053. eCollection 2018 Apr. PLoS Comput Biol. 2018. PMID: 29630593 Free PMC article.
-
UGM: a more stable procedure for large-scale multiple testing problems, new solutions to identify oncogene.Theor Biol Med Model. 2019 Dec 23;16(1):20. doi: 10.1186/s12976-019-0117-1. Theor Biol Med Model. 2019. PMID: 31865918 Free PMC article. Review.
Cited by
-
Use of a combined antibacterial synergy approach and the ANNOgesic tool to identify novel targets within the gene networks of multidrug-resistant Klebsiella pneumoniae.mSystems. 2024 Mar 19;9(3):e0087723. doi: 10.1128/msystems.00877-23. Epub 2024 Feb 13. mSystems. 2024. PMID: 38349171 Free PMC article.
-
TCC-GUI: a Shiny-based application for differential expression analysis of RNA-Seq count data.BMC Res Notes. 2019 Mar 13;12(1):133. doi: 10.1186/s13104-019-4179-2. BMC Res Notes. 2019. PMID: 30867032 Free PMC article.
-
Adaptive divergence and underlying mechanisms in response to salinity gradients between two Crassostrea oysters revealed by phenotypic and transcriptomic analyses.Evol Appl. 2022 Apr 18;16(2):234-249. doi: 10.1111/eva.13370. eCollection 2023 Feb. Evol Appl. 2022. PMID: 36793677 Free PMC article.
-
Biphasic regulation of tumorigenesis by PTK7 expression level in esophageal squamous cell carcinoma.Sci Rep. 2018 Jun 4;8(1):8519. doi: 10.1038/s41598-018-26957-6. Sci Rep. 2018. PMID: 29867084 Free PMC article.
-
ARS2/MAGL signaling in glioblastoma stem cells promotes self-renewal and M2-like polarization of tumor-associated macrophages.Nat Commun. 2020 Jun 12;11(1):2978. doi: 10.1038/s41467-020-16789-2. Nat Commun. 2020. PMID: 32532977 Free PMC article.
References
MeSH terms
Substances
LinkOut - more resources
Full Text Sources
Other Literature Sources
