. 2016 Aug 17;11(8):e0161348.
doi: 10.1371/journal.pone.0161348. eCollection 2016.

Positive Selection Pressure Drives Variation on the Surface-Exposed Variable Proteins of the Pathogenic Neisseria

Affiliations

Positive Selection Pressure Drives Variation on the Surface-Exposed Variable Proteins of the Pathogenic Neisseria

Jenny Wachter et al. PLoS One. .

Abstract

Pathogenic species of Neisseria utilize variable outer membrane proteins to facilitate infection and proliferation within the human host. However, the mechanisms behind the evolution of these variable alleles remain largely unknown due to analysis of previously limited datasets. In this study, we have expanded upon the previous analyses to substantially increase the number of analyzed sequences by including multiple diverse strains, from various geographic locations, to determine whether positive selective pressure is exerted on the evolution of these variable genes. Although Neisseria are naturally competent, this analysis indicates that only intrastrain horizontal gene transfer among the pathogenic Neisseria principally account for these genes exhibiting linkage equilibrium which drives the polymorphisms evidenced within these alleles. As the majority of polymorphisms occur across species, the divergence of these variable genes is dependent upon the species and is independent of geographical location, disease severity, or serogroup. Tests of neutrality were able to detect strong selection pressures acting upon both the opa and pil gene families, and were able to locate the majority of these sites within the exposed variable regions of the encoded proteins. Evidence of positive selection acting upon the hypervariable domains of Opa contradicts previous beliefs and provides evidence for selection of receptor binding. As the pathogenic Neisseria reside exclusively within the human host, the strong selection pressures acting upon both the opa and pil gene families provide support for host immune system pressure driving sequence polymorphisms within these variable genes.


Conflict of interest statement

The authors have declared that no competing interests exist.

Figures
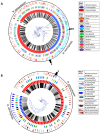
Fig 1
Fig 1. pil and opa phylogenetic trees.
(a) 219 pil genes analyzed; (b) 86 opa genes analyzed. The trees depicted were determined using the GTR model of Fasttree. The colored boxes closest to the trees indicate the strain of N. gonorrhoeae or N. meningitidis (ring 1), while the second ring signifies the species of the isolate, either N. gonorrhoeae or N. meningitidis. The third ring denotes the geographical region of the isolate, when known, while the outermost ring indicates the severity of the disease or the serogroup of the strain. The bootstrap values as calculated with the Shimodaira-Hasegawa test are depicted as colored branches, where red branches indicate minimum bootstrap values (0), green indicate median bootstrap values, and blue indicate maximum bootstrap values (1). While the polymorphisms, insertions, and deletions within the majority of pil and opa genes are unique to a single species (either N. gonorrhoeae or N. meningitidis; as indicated by the solid lines above the figures), there is a single pil gene from Gc indicated by arrow 1 and three from Mc indicated by arrow 2 in (a) and two opa genes from Mc indicated by arrow and 3 in (b) that display more homology to genes from the opposite species.
Fig 2
Fig 2. Location of polymorphisms within nucleotide alignments.
Nucleotide alignments of (a) 69 GC opa genes and 17 MC opa genes and (b) 148 GC pil genes and 71 MC pil genes. Red circles indicate intra-species polymorphisms within Gc (a and b), blue squares indicate intra-species polymorphisms within Mc (a and b), and black diamonds indicate inter-species polymorphisms present within opa and pil genes of Gc and Mc (a and b). The lines along the bottom indicate the conserved regions (black line), the variable regions (dark gray boxes), and for opa, the membrane-spanning regions (light gray boxes).
Fig 3
Fig 3. Location of synonymous and nonsynonymous polymorphisms.
Nucleotide alignments of opa (Gc = 69 and Mc = 17) and pil (Gc = 148 and Mc = 71) were analyzed for the presence of synonymous (opa, panel a and pil, panel c) and nonsynonymous polymorphisms (opa, panel b and pil, panel d). The graph demonstrates the diversity values (Pi or Theta) present amongst sequences based on the location in the nucleotide alignment. The nucleotide diversity occurring between Gc and Mc (thick black line), within Gc (red line), within Mc (blue line), and within each species of Gc (dashed red lines) and Mc (dashed blue lines) are shown. The lines along the top indicate the conserved regions (black line), the variable regions (dark gray boxes), and the opa membrane-spanning regions (light gray boxes). A larger number of both synonymous and nonsynonymous polymorphisms can be seen within the variable regions of opa within Gc and Mc. Compared to opa, relatively few polymorphisms are present within pil, however, the polymorphisms present occur within the variable mini-cassettes.
Fig 4
Fig 4. Location of interstrain synonymous and nonsynonymous polymorphisms within nucleotide alignments of opa.
Nucleotide alignments of opa from Mc (n = 17) and Gc (n = 69) were analyzed for synonymous (Mc, panel a, Gc, panel c) and nonsynonymous (Mc, panel b, Gc, panel d) polymorphisms. The graph demonstrates the diversity values (Theta) present amongst sequences based on the location in the nucleotide alignment. The nucleotide diversity occurring between species is demonstrated below the figures. The lines along the top indicate the conserved regions (black line), the variable regions (dark gray boxes), and the membrane-spanning regions (light gray boxes). While the synonymous polymorphisms occurring within opa appear to be dependent on the strain of Mc or Gc, nonsynonymous polymorphisms occur within the same regions of the nucleotide alignment, regardless of species, and are almost exclusive to the variable regions of opa.
Fig 5
Fig 5. Location of interstrain synonymous and nonsynonymous polymorphisms within nucleotide alignments of pil.
Nucleotide alignments of pil from Mc (n = 71) and Gc (n = 148) were analyzed for synonymous (Mc, panel a, Gc, panel c) and nonsynonymous polymorphisms (Mc, panel b, Gc, panel d). The graph demonstrates the diversity values (Theta) present amongst sequences based on the location in the nucleotide alignment. The nucleotide diversity occurring between species is demonstrated below the figures. The lines along the top indicate the conserved regions (black line), and the variable regions (dark gray boxes). The pil genes of Mc display slightly different synonymous polymorphisms near the 5′ end of the nucleotide alignment, however, the majority of pil genes within Mc and Gc possess similar locations containing synonymous and nonsynonymous polymorphisms.
Fig 6
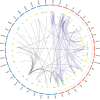
Fig 6. Linkage map of detected pil and opa recombination events.
Geneconv was used to detect statistically significant evidence (p < 0.05) for gene conversion events between the pil and opa genes of Gc and Mc [56]. Statistically significant gene conversion fragments were further parsed to remove any implied recombination events that occurred entirely within constant regions of the genes. Chromosomes of Mc are shown in blue while chromosomes of Gc are shown in red, all chromosomes are denoted by the strains of Mc or Gc they represent. Any scaffold chromosomes (assembled as contigs) are shown as thin grey lines inset to the chromosomes they represent. opa are shown as either green (sense) or yellow (antisense) bars relative to their locations on the chromosome. pil are shown inset to opa as either green (sense) or yellow (antisense) bars relative to their locations on the chromosome. Statistically significant gene conversion events are displayed as lines connecting either opa (purple) or pil (black) genes.
Fig 7
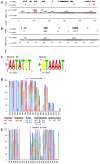
Fig 7. Location and analysis of detected selection pressures within opa and pil.
Alignments of opa (a) and pil (b) from Gc (opa, n = 69; pil, n = 148) and Mc (opa, n = 17; pil, n = 71) were analyzed for selection pressures using the Bayes Empirical Bayes analysis implemented under the alternative model of PAML and Tajima’s test. The figure demonstrates the statistically relevant locations exhibiting either positive or negative selection pressures detected under each test for interspecies (black diamonds) and interstrain alignments of Gc (red circles) and Mc (blue squares). The lines along the bottom indicate the conserved regions (black line), and the variable regions (gray boxes), and for opa the membrane spanning regions (red boxes). The majority of positively selected sites within pil and opa occur within the variable regions. Two pil non-canonical promoter motifs detected from small transcriptome studies of N. gonorrhoeae strain MS11 were found to be highly conserved among the 219 pil genes analyzed, as shown by sequence logos (c) in which the height of the nucleotides in the logo demonstrate their conservation among pil. Their locations within pil are shown by black bars in mc5 and the constant region between mc3 and mc2 (b). The relative percentage of amino acids present within the HV1 (d) and HV2 (e) variable regions of the Opacity proteins. The positively selected regions within HV1 and HV2 are shown as diamonds above their respective amino acid positions. As can be seen, nonsynonymous polymorphisms are highly prevalent within these positively selected regions with the amino acids present within these regions being highly varied.
Fig 8
Fig 8. Location of positively selected amino acids in Opa.
The three dimensional structure of Opa was obtained from PDB ID 2MAF [75]. The Consurf Server was used to align the amino acid multiple sequence alignment of the Opa proteins used in this study to the sequence of the 2MAF Opa60 structure [–74]. Polymorphisms present in the Opa proteins from this study were depicted with UCSF Chimera, where cyan sites indicate the highest degree of variability and maroon sites indicate the most conserved regions [76]. The ribbons denoting the SV, HV1, and HV2 regions are shown larger than the other areas of the protein. The positively selected sites determined from the Bayes Empirical Bayes theorem implemented through PAML are shown as gray spheres [46]. This analysis shows that the three variable regions of the protein show strong evidence for being under positive selection, with the conserved regions showing relatively no evidence of sequence diversity or selection.
Fig 9
Fig 9. Location of positively selected amino acids in Pil.
The three dimensional structure of Pil was obtained from PDB ID 2HIL [15]. The Consurf Server was used to align the amino acid multiple sequence alignment of the Pil proteins used in this study to the sequence of the 2HIL structure [–74]. Polymorphisms present in the Pil proteins from this study were depicted with UCSF Chimera, where black sites indicate the highest degree of variability and white sites indicate the most conserved regions [76]. The ribbons denoting the variable minicassettes are shown larger than the other areas of the protein. The positively selected sites determined from the Bayes Empirical Bayes theorem implemented through PAML are shown as grey spheres [46]. This analysis shows that the variable regions of the protein show strong evidence for being under positive selection, with the conserved regions showing relatively no evidence of sequence diversity or selection.

Similar articles

Cited by

References

    1. Scherp HW. Neisseria and Neisserial Infections. Annu Rev Microbiol. 1955;9: 319–334. - PubMed
    1. Kellogg DS, Peacock WL, Deacon WE, Brown L, Pirkle DI. Neisseria gonorrhoeae I. Virulence Genetically Linked to Clonal Variation. J Bacteriol. 1963;85: 1274–1279. - PMC - PubMed
    1. Kellogg DS, Cohen IR, Norins LC, Schroeter AL, Reising G. Neisseria gonorrhoeae II. Colonial Variation and Pathogenicity During 35 Months In Vitro. J Bacteriol. 1968;96: 596–605. - PMC - PubMed
    1. Bessen D, Gotschlich EC. Interactions of gonococci with HeLa cells: attachment, detachment, replication, penetration, and the role of protein II. Infect Immun. 1986;54: 154–160. - PMC - PubMed
    1. Kupsch EM, Knepper B, Kuroki T, Heuer I, Meyer TF. Variable opacity (Opa) outer membrane proteins account for the cell tropisms displayed by Neisseria gonorrhoeae for human leukocytes and epithelial cells. EMBO J. 1993;12: 641–650. - PMC - PubMed

MeSH terms