

Simple LC-MS Method for Differentiation of Isobaric Phosphatidylserines and Phosphatidylcholines with Deuterated Mobile Phase Additives
- PMID: 27532481
- PMCID: PMC6045954
- DOI: 10.1021/acs.analchem.6b02063
Simple LC-MS Method for Differentiation of Isobaric Phosphatidylserines and Phosphatidylcholines with Deuterated Mobile Phase Additives
Abstract
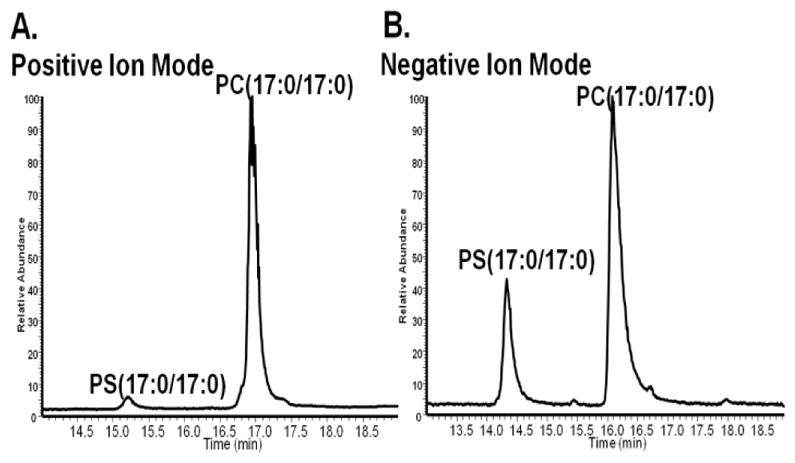
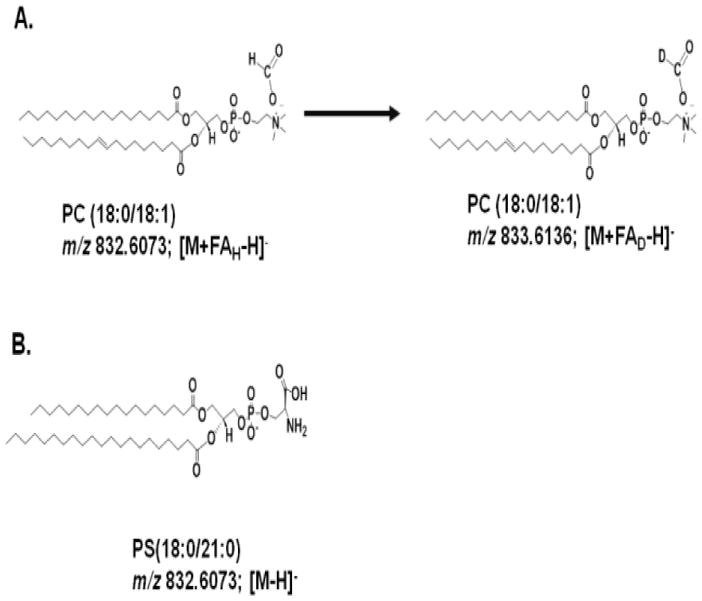
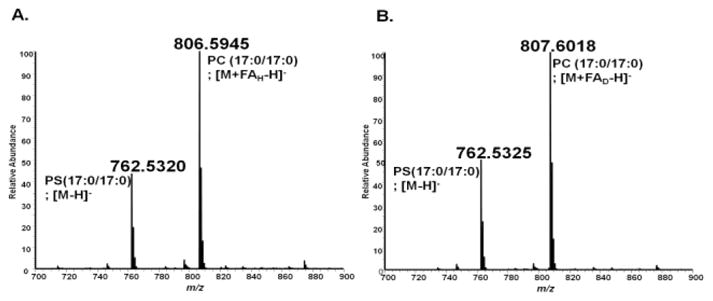
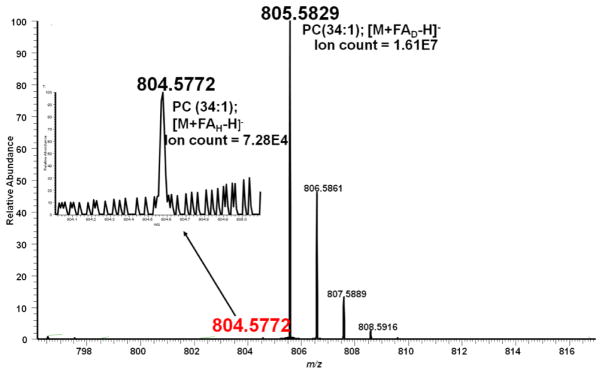
Lipids from different classes sometimes can exhibit the same exact mass upon electrospray ionization; this presents an analytical challenge in lipidomics. In the negative ionization mode, for example, this can occur with phosphatidylcholines (PCs) and phosphatidylserines (PSs), making them indistinguishable in the absence of fragmentation data. PSs are found at low concentrations in biological samples, making MS/MS spectra difficult to obtain. Moreover, while PCs and PSs are distinguishable in the positive mode, PSs do not ionize as well as PCs, and their ionization is suppressed by the PCs. Here, we show that, in the negative ionization mode, substituting protiated LC-MS additives with their deuterated forms provides a way to distinguish PCs and PSs without chemical derivatization. The method described leverages the differential ionization mechanism of PCs and PSs. PCs are ionized via adduction with salts, whereas PSs ionize via hydrogen abstraction. Substituting the salts used for LC-MS with their deuterated form shifts the mass of PCs by the number of deuterium atoms in the salt, while the mass of PSs remains the same. This comparative shift enables their direct differentiation. We demonstrate that the use of deuterated formate shifts the mass of PCs and provides a direct method to distinguish PCs and PSs, even at biologically relevant low concentrations. The utility of the method was established and validated in the simultaneous analysis of PCs and PSs in lipid extracts from isolated liver mitochondria in two different rat strains. Thirteen low concentration PSs were identified that would otherwise not have been distinguishable from low concentration PCs.
Figures


Similar articles
-
Recent Advances on Mass Spectrometry Analysis of Nitrated Phospholipids.Anal Chem. 2016 Mar 1;88(5):2622-9. doi: 10.1021/acs.analchem.5b03407. Epub 2016 Feb 12. Anal Chem. 2016. PMID: 26814598
-
Role of ammonium in the ionization of phosphatidylcholines during electrospray mass spectrometry.Rapid Commun Mass Spectrom. 2017 Feb 15;31(3):264-268. doi: 10.1002/rcm.7788. Rapid Commun Mass Spectrom. 2017. PMID: 27862466 Free PMC article.
-
Development of a reverse-phase liquid chromatography electrospray ionization mass spectrometry method for lipidomics, improving detection of phosphatidic acid and phosphatidylserine.Anal Biochem. 2008 Apr 1;375(1):124-31. doi: 10.1016/j.ab.2007.12.027. Epub 2007 Dec 25. Anal Biochem. 2008. PMID: 18206977
-
Derivatization in liquid chromatography/mass spectrometric analysis of neurosteroids.Se Pu. 2001 Nov;19(6):508-12. Se Pu. 2001. PMID: 12545460 Review.
-
Sensitivity enhancement in liquid chromatography/atmospheric pressure ionization mass spectrometry using derivatization and mobile phase additives.J Chromatogr B Analyt Technol Biomed Life Sci. 2005 Oct 25;825(2):98-110. doi: 10.1016/j.jchromb.2005.04.021. J Chromatogr B Analyt Technol Biomed Life Sci. 2005. PMID: 15897015 Review.
Cited by
-
Imaging regiospecific lipid turnover in mouse brain with desorption electrospray ionization mass spectrometry.J Lipid Res. 2017 Sep;58(9):1884-1892. doi: 10.1194/jlr.M078170. Epub 2017 Jul 25. J Lipid Res. 2017. PMID: 28743728 Free PMC article.
-
Trimethylation Enhancement Using 13C-Diazomethane: Gas-Phase Charge Inversion of Modified Phospholipid Cations for Enhanced Structural Characterization.Anal Chem. 2017 Sep 5;89(17):9452-9458. doi: 10.1021/acs.analchem.7b02271. Epub 2017 Aug 15. Anal Chem. 2017. PMID: 28764333 Free PMC article.
-
Bifunctional Tagging through N-Doped Ozonide for Charge Switching and Isomeric Characterization of Glycerophospholipids Using Tandem Mass Spectrometry.Anal Chem. 2025 Apr 29;97(16):8992-8999. doi: 10.1021/acs.analchem.5c00443. Epub 2025 Apr 17. Anal Chem. 2025. PMID: 40245258 Free PMC article.
References
Publication types
MeSH terms
Substances
Grants and funding
LinkOut - more resources
Full Text Sources
Other Literature Sources
