. 2016 Aug 17;11(8):e0161365.
doi: 10.1371/journal.pone.0161365. eCollection 2016.

Modeling Mosquito-Borne Disease Spread in U.S. Urbanized Areas: The Case of Dengue in Miami

Affiliations

Modeling Mosquito-Borne Disease Spread in U.S. Urbanized Areas: The Case of Dengue in Miami

Michael A Robert et al. PLoS One. .

Abstract

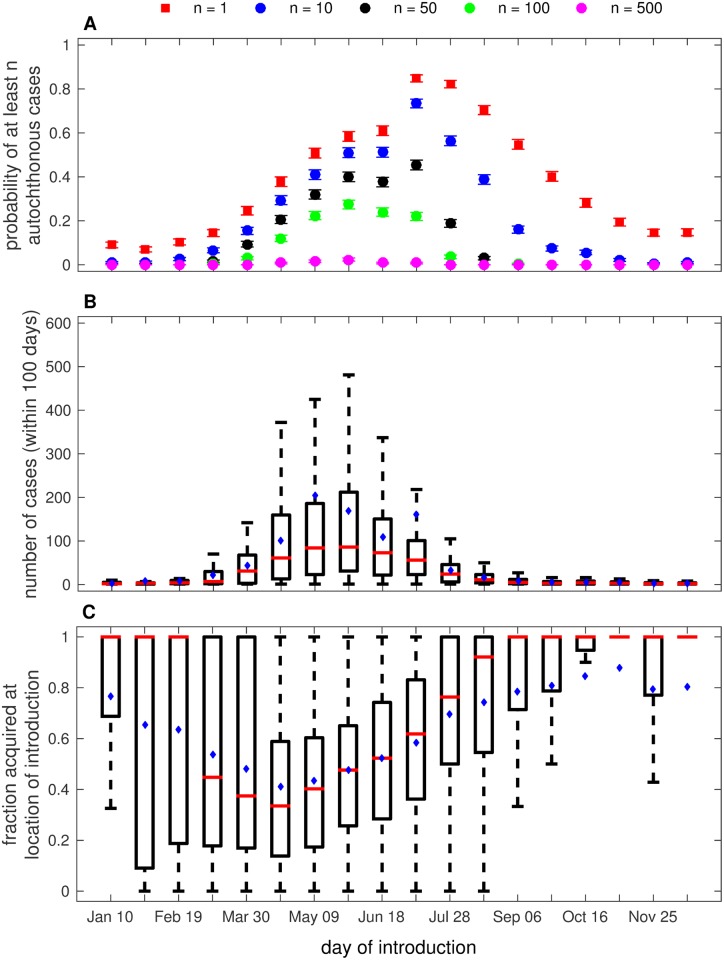
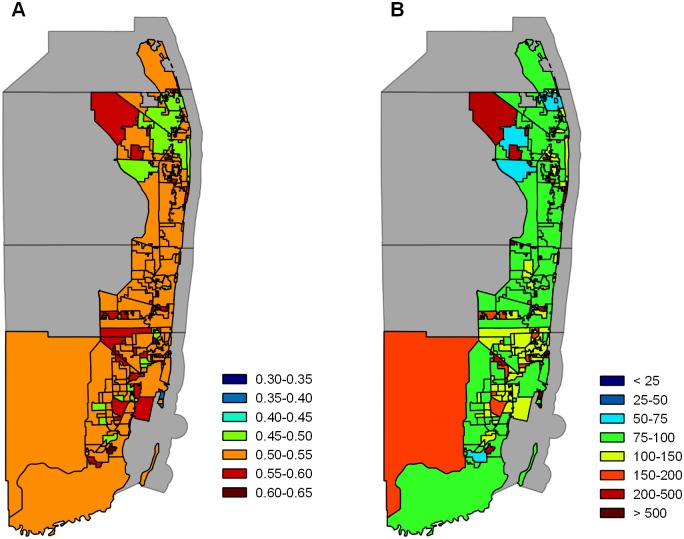
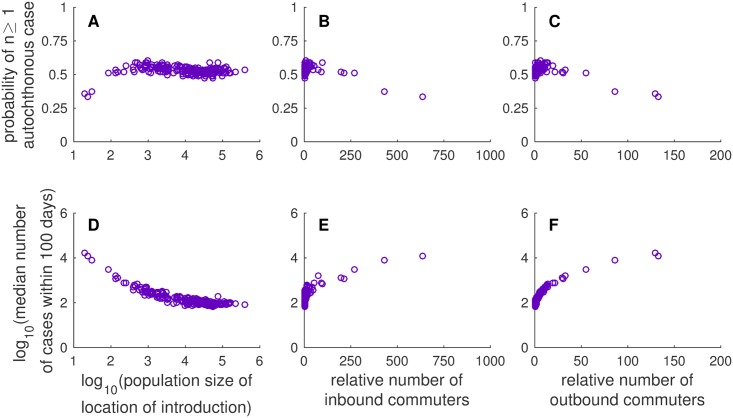
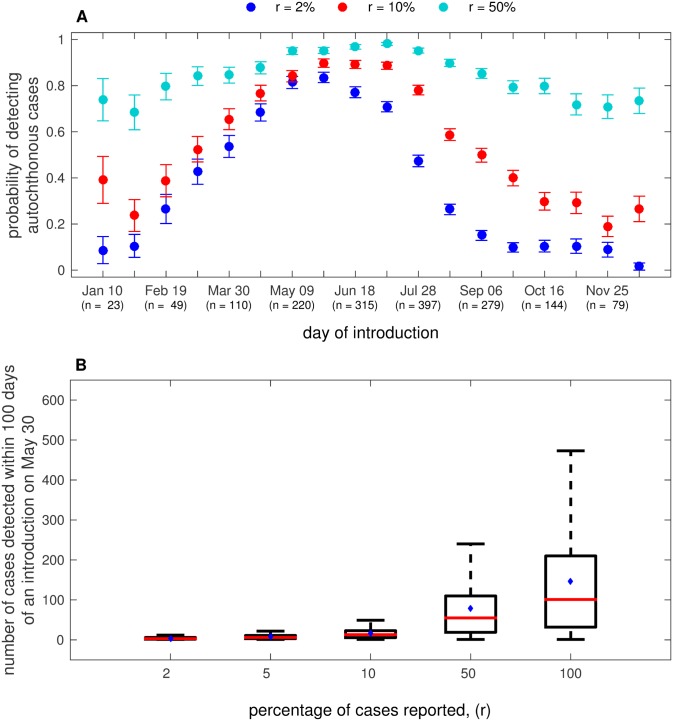
Expansion of mosquito-borne pathogens into more temperate regions of the world necessitates tools such as mathematical models for understanding the factors that contribute to the introduction and emergence of a disease in populations naïve to the disease. Often, these models are not developed and analyzed until after a pathogen is detected in a population. In this study, we develop a spatially explicit stochastic model parameterized with publicly available U.S. Census data for studying the potential for disease spread in Urbanized Areas of the United States. To illustrate the utility of the model, we specifically study the potential for introductions of dengue to lead to autochthonous transmission and outbreaks in a population representative of the Miami Urbanized Area, where introductions of dengue have occurred frequently in recent years. We describe seasonal fluctuations in mosquito populations by fitting a population model to trap data provided by the Miami-Dade Mosquito Control Division. We show that the timing and location of introduced cases could play an important role in determining both the probability that local transmission occurs as well as the total number of cases throughout the entire region following introduction. We show that at low rates of clinical presentation, small outbreaks of dengue could go completely undetected during a season, which may confound mitigation efforts that rely upon detection. We discuss the sensitivity of the model to several critical parameter values that are currently poorly characterized and motivate the collection of additional data to strengthen the predictive power of this and similar models. Finally, we emphasize the utility of the general structure of this model in studying mosquito-borne diseases such as chikungunya and Zika virus in other regions.


Conflict of interest statement

Competing Interests: The authors have declared that no competing interests exist.

Figures

Fig 1
Fig 1. The impact of the timing of introduction on local transmission and outbreak.
(A) The probability that at least n autochthonous cases occurred following a single introduction on the date given on the horizontal axis (error bars are the probability of autochthonous transmission ± the binomial standard deviation). (B) The total number of dengue cases that occurred within 100 days of a single introduction on the date listed along the horizontal axis. (C) The fraction of total cases that occurred in the location of introduction. All other parameter values are as given in Table 1. In the box plots in (B) and (C), red lines indicate the median, blue dots indicate the mean, and the box represents the interquartile range. Whiskers indicate the interquartile range multiplied by 1.5.
Fig 2
Fig 2. The impact of the location of introduction on local transmission and outbreak throughout the entire Miami UA.
Probability that at least one autochthonous case occurred in the Miami UA (A) and the total number of dengue cases that occurred throughout the entire Miami UA in the first 100 days (B) following a single introduction on May 30 in each of the 186 locations. The metric presented on each map represents the metric for an introduction in that location. All other parameter values are as given in Table 1. The map included in this figure was obtained from U.S. Census Bureau TIGER/LINE®Shapefiles [71].
Fig 3
Fig 3. Scatter plots of relationships between location of introduction characteristics and metrics of outbreak probability and size.
Each column shows a different population of introduction characteristic: (A,D) population size (log scale), (B,E) the number of commuters traveling to the population of introduction relative to the population size of the location, and (C,F) the number of commuters traveling from the location of introduction relative to the population size of the location. The first row (A-C) shows the probability of at least one autochthonous case, and the second row (D-F) shows the median number of cases that occurred within 100 days of introduction (log scale). These relationships were generated from the model output presented in the Fig 2.
Fig 4
Fig 4. Probability of detecting local transmission at different reporting rates.
(A) The probability of detecting local transmission at different reporting rates (r) for different days of introduction (error bars are the probability of autochthonous transmission ± the binomial standard deviation). (B) The total number of cases detected in the first 100 days following a single introduction on May 30 for different reporting rates. All other parameter values are as given in Table 1. In (A), the number in parentheses indicates the number of total simulations (out of 500 total simulations) in which at least one autochthonous case of transmission occurred. In the boxplot in (B), red lines indicate the median, blue dots indicate the mean, and the box represents the interquartile range. Whiskers indicate the interquartile range multiplied by 1.5.
Fig 5
Fig 5. Sensitivity analysis for the average vector-host ratio and transmission rate β.
Heat maps depict cumulative distributions of the probability of autochthonous transmission as it varies with changes in the average-vector host ratio (A) and β (B), and the median number of cases that occur within 100 days of introduction as it varies with changes in the average vector-host ratio (C) and β (D). Note that the axis for the median number of cases that occur within 100 days is on a log10 scale. In each heat map, the parameters on the horizontal axis are divided into 30 evenly spaced groups and the values on the vertical axis are divided into 20 evenly spaced groups. The colored rectangles present the cumulative frequency of simulations conducted with parameter values in the group on the horizontal axis that led to values of the metric in the group on the vertical axis. The solid black curve represents the median value of the metric presented on the vertical axis for each group of values on the horizontal axis (i.e. 50% of the simulations conducted with parameters in the the range of values on the horizontal axis led to values of the metric on the vertical axis higher than those at the curve). These figures were generated from 5000 total simulation sets. Each simulation set is a unique parameter combination that is run 100 times. For these simulations, the average vector-host ratio ∼ Uniform(0, 3), β ∼ Uniform(0, 4), and log10(θ) ∼ Uniform(−8, −4). All other parameter values are as given in Table 1.

Similar articles

Cited by

References

    1. Gubler DJ. Resurgent vector-borne diseases as a global health problem. Emerging Infectious Diseases. 1998;4(3):442–50. 10.3201/eid0403.980326 - DOI - PMC - PubMed
    1. Gubler DJ. Vector-borne diseases. Revue Scientifique et Technique (International Office of Epizootics). 2009. August;28(2):583–8. - PubMed
    1. Tatem AJ, Huang Z, Das A, Qi Q, Roth J, Qiu Y. Air travel and vector-borne disease movement. Parasitology. 2012. December;139(14):1816–30. 10.1017/S0031182012000352 - DOI - PubMed
    1. Mackenzie JS, Gubler DJ, Petersen LR. Emerging flaviviruses: the spread and resurgence of Japanese encephalitis, West Nile and dengue viruses. Nature Medicine. 2004. December;10(12):S98–109. 10.1038/nm1144 - DOI - PubMed
    1. Nasci RS. Movement of Chikungunya Virus into the Western Hemisphere. Emerging Infectious Diseases. 2014. August;20(8):1394–1395. 10.3201/eid2008.140333 - DOI - PMC - PubMed