

Intestinal Sucrase as a Novel Target Contributing to the Regulation of Glycemia by Prebiotics
- PMID: 27532866
- PMCID: PMC4988693
- DOI: 10.1371/journal.pone.0160488
Intestinal Sucrase as a Novel Target Contributing to the Regulation of Glycemia by Prebiotics
Abstract
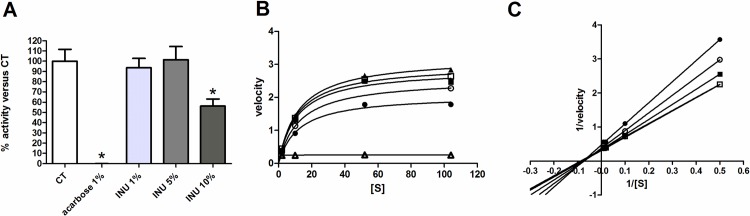
Inulin-type fructans (ITF) are known for their capacity to modulate gut microbiota, energy metabolism and to improve glycemia in several animal models of obesity, and in humans. The potential contribution of ITF as modulators of sugar digestion by host enzymes has not been evaluated yet. A sucrose challenge has been performed on naive mice fed a standard diet supplemented with or without native chicory inulin (Fibruline 5%) for 3 weeks. The area under the curve of glycemia as well as sucrase activity in the small intestine were lowered after inulin treatment. Pyrosequencing of the 16S rRNA gene confirmed important changes in gut microbiota (mostly in favor of Blautia genus) due to inulin extract supplementation. Interestingly, the suppressive effect of inulin extract on postprandial glycemia also occurred when inulin was directly added to the sucrose solution, suggesting that the effect on sucrose digestion did not require chronic inulin administration. In vitro tests confirmed a direct inhibition of sucrase enzyme by the inulin extract, thereby suggesting that native chicory inulin, in addition to its well-known prebiotic effect, is also able to decrease the digestibility of carbohydrates, a phenomenon that can contribute in the control of post prandial glycemia. We may not exclude that the sucrose escaping the digestion could also contribute to the changes in the gut microbiota after a chronic treatment with inulin.
Conflict of interest statement
Figures


Similar articles
-
Interest of inulin in obesity: comparison of the prebiotic effect of edible-food sources versus purified inulin from chicory root.Eur J Nutr. 2025 Apr 5;64(4):148. doi: 10.1007/s00394-025-03640-x. Eur J Nutr. 2025. PMID: 40186782 Free PMC article.
-
Replacement of glycaemic carbohydrates by inulin-type fructans from chicory (oligofructose, inulin) reduces the postprandial blood glucose and insulin response to foods: report of two double-blind, randomized, controlled trials.Eur J Nutr. 2018 Apr;57(3):1259-1268. doi: 10.1007/s00394-017-1409-z. Epub 2017 Mar 3. Eur J Nutr. 2018. PMID: 28255654 Clinical Trial.
-
Inulin-type fructans improve active ulcerative colitis associated with microbiota changes and increased short-chain fatty acids levels.Gut Microbes. 2019;10(3):334-357. doi: 10.1080/19490976.2018.1526583. Epub 2018 Nov 5. Gut Microbes. 2019. PMID: 30395776 Free PMC article.
-
Effect of fructans, prebiotics and fibres on the human gut microbiome assessed by 16S rRNA-based approaches: a review.Benef Microbes. 2020 Mar 27;11(2):101-129. doi: 10.3920/BM2019.0082. Epub 2020 Feb 19. Benef Microbes. 2020. PMID: 32073295 Review.
-
Inulin-type prebiotics--a review: part 1.Altern Med Rev. 2008 Dec;13(4):315-29. Altern Med Rev. 2008. PMID: 19152479 Review.
Cited by
-
Evaluation of the hypoglycaemic and antioxidant effects of submerged Ganoderma lucidum cultures in type 2 diabetic rats.Mycology. 2020 Mar 1;12(2):82-93. doi: 10.1080/21501203.2020.1733119. Mycology. 2020. PMID: 34026300 Free PMC article.
-
Network Pharmacology-Based Analysis of Gegenqinlian Decoction Regulating Intestinal Microbial Activity for the Treatment of Diarrhea.Evid Based Complement Alternat Med. 2021 Jul 26;2021:5520015. doi: 10.1155/2021/5520015. eCollection 2021. Evid Based Complement Alternat Med. 2021. PMID: 34354757 Free PMC article.
-
A Randomized Placebo Controlled Clinical Trial to Determine the Impact of Digestion Resistant Starch MSPrebiotic® on Glucose, Insulin, and Insulin Resistance in Elderly and Mid-Age Adults.Front Med (Lausanne). 2018 Jan 22;4:260. doi: 10.3389/fmed.2017.00260. eCollection 2017. Front Med (Lausanne). 2018. PMID: 29410955 Free PMC article.
-
Traditional Processed Meat Products Re-designed Towards Inulin-rich Functional Foods Reduce Polyps in Two Colorectal Cancer Animal Models.Sci Rep. 2019 Oct 15;9(1):14783. doi: 10.1038/s41598-019-51437-w. Sci Rep. 2019. PMID: 31616028 Free PMC article.
-
Inulin Improves Postprandial Hypertriglyceridemia by Modulating Gene Expression in the Small Intestine.Nutrients. 2018 Apr 25;10(5):532. doi: 10.3390/nu10050532. Nutrients. 2018. PMID: 29693598 Free PMC article.
References
MeSH terms
Substances
Grants and funding
LinkOut - more resources
Full Text Sources
Other Literature Sources
Medical
