. 2017 Mar;56(3):833-848.
doi: 10.1002/mc.22537. Epub 2016 Sep 5.

Silibinin inhibits hypoxia-induced HIF-1α-mediated signaling, angiogenesis and lipogenesis in prostate cancer cells: In vitro evidence and in vivo functional imaging and metabolomics

Affiliations

Silibinin inhibits hypoxia-induced HIF-1α-mediated signaling, angiogenesis and lipogenesis in prostate cancer cells: In vitro evidence and in vivo functional imaging and metabolomics

Gagan Deep et al. Mol Carcinog. 2017 Mar.

Abstract

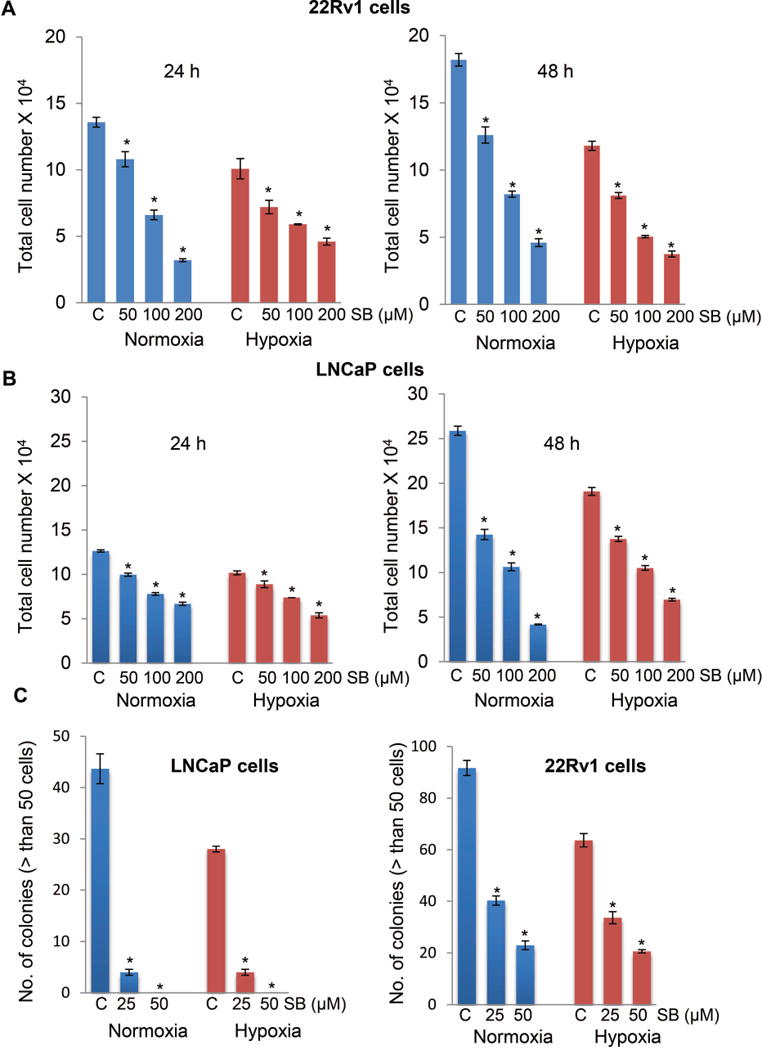
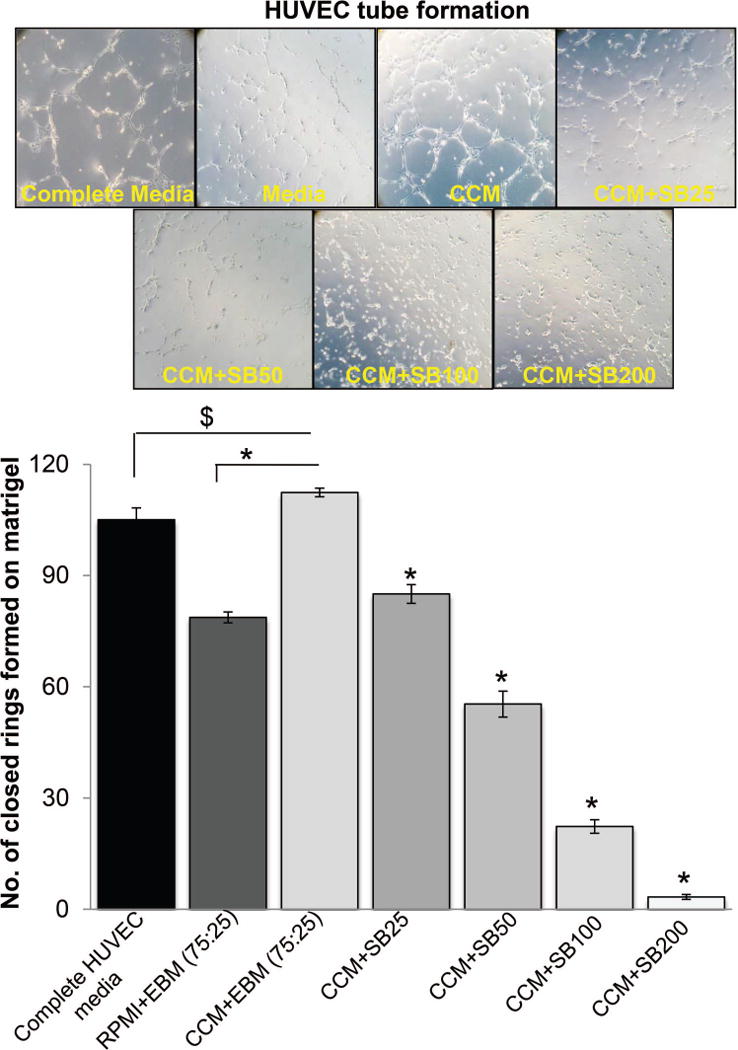
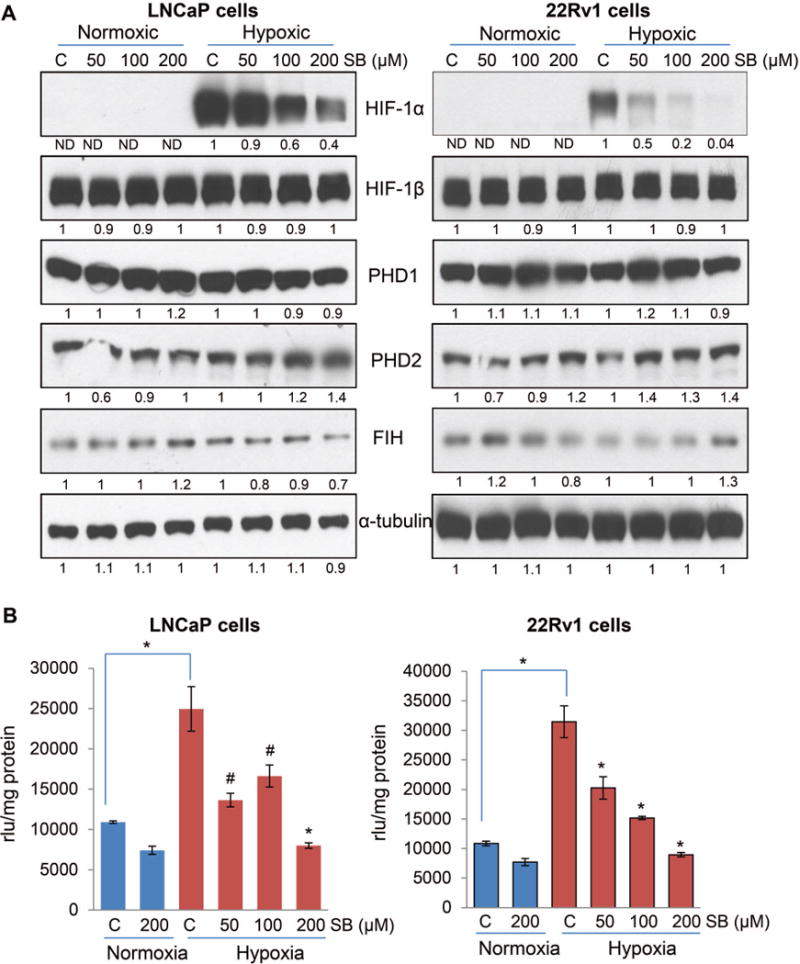
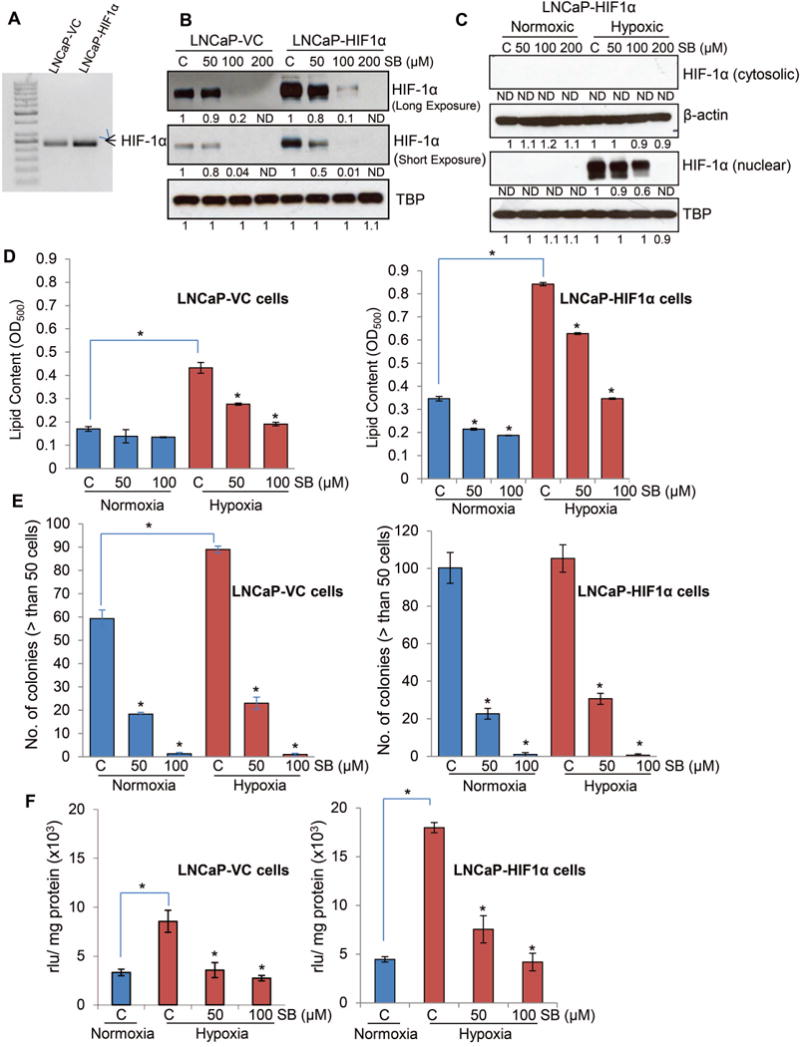
Hypoxia is associated with aggressive phenotype and poor prognosis in prostate cancer (PCa) patients suggesting that PCa growth and progression could be controlled via targeting hypoxia-induced signaling and biological effects. Here, we analyzed silibinin (a natural flavonoid) efficacy to target cell growth, angiogenesis, and metabolic changes in human PCa, LNCaP, and 22Rv1 cells under hypoxic condition. Silibinin treatment inhibited the proliferation, clonogenicity, and endothelial cells tube formation by hypoxic (1% O2 ) PCa cells. Interestingly, hypoxia promoted a lipogenic phenotype in PCa cells via activating acetyl-Co A carboxylase (ACC) and fatty acid synthase (FASN) that was inhibited by silibinin treatment. Importantly, silibinin treatment strongly decreased hypoxia-induced HIF-1α expression in PCa cells together with a strong reduction in hypoxia-induced NADPH oxidase (NOX) activity. HIF-1α overexpression in LNCaP cells significantly increased the lipid accumulation and NOX activity; however, silibinin treatment reduced HIF-1α expression, lipid levels, clonogenicity, and NOX activity even in HIF-1α overexpressing LNCaP cells. In vivo, silibinin feeding (200 mg/kg body weight) to male nude mice with 22Rv1 tumors, specifically inhibited tumor vascularity (measured by dynamic contrast-enhanced MRI) resulting in tumor growth inhibition without directly inducing necrosis (as revealed by diffusion-weighted MRI). Silibinin feeding did not significantly affect tumor glucose uptake measured by FDG-PET; however, reduced the lipid synthesis measured by quantitative 1 H-NMR metabolomics. IHC analyses of tumor tissues confirmed that silibinin feeding decreased proliferation and angiogenesis as well as reduced HIF-1α, FASN, and ACC levels. Together, these findings further support silibinin usefulness against PCa through inhibiting hypoxia-induced signaling. © 2016 Wiley Periodicals, Inc.

Keywords: hypoxia; hypoxia-inducible factor; lipogenesis; prostate cancer; silibinin.


Figures

Figure 1
Figure 1
Silibinin inhibits cell viability and clonogenicity of human PCa cells under both normoxic and hypoxic conditions. (A-B) Human PCa LNCaP and 22Rv1 cells were treated with DMSO or silibinin (50–200 μM) under normoxic (21% O2) or hypoxic (1% O2) conditions, and total cell number was determined after 24 and 48 hrs. (C) LNCaP and 22Rv1 cells (500 cells/well) were maintained under normoxic (21% O2) or hypoxic conditions (1% O2) for 48 hrs. Thereafter, plates under hypoxia were returned to normoxic conditions and cultured with or without silibinin (25 and 50 μM). Number of colonies with greater than 50 cells were counted in each of the treatment groups after 6 days. The data shown are mean±SEM of three samples. *, p ≤ 0.001
Figure 2
Figure 2
Silibinin inhibits hypoxic PCa cells-induced capillary tube formation by HUVECs. HUVECs (4 × 10⁴ per well) were placed in 24-well plates coated with matrigel with complete HUVEC media, or media mixture (RMPI+EBM) with 0.5% serum, or control conditioned media (CCM) from hypoxic LNCaP cells with DMSO or various concentrations of silibinin (25–200 μM). After 12 hrs, tubular structures were photographed at 100× magnification and number of closed rings formed in each group was counted. Number of closed rings is presented as mean±SEM of three samples for each treatment. *, p ≤ 0.001; #, p ≤ 0.01; $, p ≤ 0.05
Figure 3
Figure 3
Silibinin inhibits hypoxia-induced lipid accumulation in human PCa cells. (A-B) LNCaP and 22Rv1 cells were cultured under normoxic or hypoxic conditions with or without silibinin (90 μM) for 48 hrs. Thereafter, lipid content in the cells was measured by Oil Red O staining. Relative absorbance (normalized with relative cell count) as well as corresponding photomicrographs (lipid droplet appears red in color) is presented. *, p ≤ 0.001; #, p ≤ 0.01. (C) LNCaP and 22Rv1 cells were cultured under normoxic (21% O2) or hypoxic (1% O2) conditions in the presence of DMSO or silibinin (50–200 μM) for 6 hrs. At the end, total cell lysates were prepared and analyzed for p-ACC, total ACC and FASN by Western blotting. Membranes were stripped and reprobed for β-actin to assess equal protein loading. Densitometry data presented below the bands are ‘fold change’ as compared with respective control after normalization with respective loading control (β-actin).
Figure 4
Figure 4
Silibinin inhibits HIF-1α expression and NOX activity in PCa cells under hypoxic conditions. (A) LNCaP and 22Rv1 cells were cultured under normoxic (21% O2) or hypoxic (1% O2) conditions in the presence of DMSO or silibinin (50–200 μM) for 6 hrs. At the end, total cell lysates were prepared and analyzed for HIF-1α, HIF-1β, FIH, PHD1 and 2 by Western blotting. Membranes were stripped and reprobed for α-tubulin to assess equal protein loading. Densitometry data presented below the bands are ‘fold change’ as compared with respective control after normalization with respective loading control (α-tubulin). ND: Not detectable. (B) LNCaP and 22Rv1 cells (4 × 10⁵ cells/60 mm culture dish) were grown under standard culture condition and after 36 hrs of seeding cells were cultured under normoxic (21% O2) or hypoxic (1% O2) conditions in the presence of DMSO or silibinin for 24 hrs. At the end, cells were harvested and NOX activity was measured as mentioned in ‘Materials and Methods’ and represented as rlu/mg protein. Each value represents mean ± SEM of three samples for each treatment. *, p ≤ 0.001; #, p ≤ 0.01
Figure 5
Figure 5
Effect of silibinin on lipid accumulation, clonogenicity and NOX activity in PCa cells overexpressing HIF-1α under hypoxic conditions. (A) HIF-1α was overexpressed in LNCaP cells using lentiviral particles as detailed in the methods. HIF-1α overexpression was confirmed by RT-PCR. (B) LNCaP-VC and LNCaP-HIF1α cell were cultured under hypoxic (1% O2) conditions in the presence of DMSO or silibinin (50–200 μM) for 6 hrs. At the end, nuclear fractions were prepared and analyzed for HIF-1α expression by Western blotting. Membranes were stripped and reprobed for TBP (TATA binding protein) to assess equal protein loading. Densitometry data presented below the bands are ‘fold change’ as compared with respective control after normalization with respective loading control (TBP). ND: Not detectable. (C) LNCaP-HIF1α cells were cultured under normoxic (21% O2) or hypoxic (1% O2) conditions in the presence of DMSO or silibinin (50–200 μM) for 6 hrs. At the end, nuclear and cytoplasmic fraction were prepared and analyzed for HIF-1α by Western blotting. Membranes were stripped and reprobed for β-actin (cytoplasmic fraction) or TBP (nuclear fraction) to assess equal protein loading. Densitometry data presented below the HIF-1α (nuclear) bands are ‘fold change’ as compared with respective control after normalization with respective loading control (TBP). ND: Not detectable. (D) LNCaP-VC and LNCaP-HIF1α cells (5 × 10⁴ cells/well of a six well plate) were grown under standard culture condition and after 36 hrs of seeding cells were cultured under normoxic or hypoxic conditions with or without silibinin for 48 hrs. Thereafter, lipid content in the cells was measured by Oil Red O staining. (E) LNCaP-VC and LNCaP-HIF1 α cell (500 cells/well) were maintained under normoxic or hypoxic conditions for 48 hrs. Thereafter, plates under hypoxia were returned to normoxic conditions and cultured with or without silibinin. Number of colonies with greater than 50 cells was counted in each of the treatment group after 6 days. Media were changed after 3 days supplemented with fresh silibinin at the indicated concentrations. (F) LNCaP-VC and LNCaP-HIF1α cells (4 × 10⁵ cells/60 mm culture dishes) were grown under standard culture condition and after 36 hrs of seeding cells were treated with silibinin and further incubated for 24 hrs under hypoxic conditions. In each case, cells cultured under normoxic condition served as relevant control. At the end of 24 hrs, cells were harvested and NOX activity was measured as mentioned in ‘Materials and Methods’ and represented as rlu/mg protein. Each value represents mean ± SEM of three samples for each treatment.
Figure 6
Figure 6
Silibinin feeding decreases 22Rv1 xenograft growth in male athymic nude mice via targeting the lipid metabolism. (A) 22Rv1 xenografts were initiated in male athymic nude mice. Mice were administered either vehicle (CMC) or 200 mg/kg body weight dose of silibinin for 16 days. Tumor volume was measured on experimental day 0, 5, 9 and 16. Each value in the bar diagram is mean ± SEM of 12 xenografts. (B) Quantitative imaging end-points derived from FDG-PET, DWI, and DCE-MRI on untreated and silibinin-treated animals; *, p ≤ 0.001; $, p ≤ 0.05; (C) ADC maps showing low ADC values for silibinin-treated animals indicating no potential loss of cellularity upon the treatment; (D) decreased gadolinium kinetics on DCE-MRI revealing lower tumor vascularity in silibinin-treated animals; (E) PLS-DA regression analysis on comprehensive imaging and metabolomics date sets; (F) Variable Importance in Projection (VIP) scores from PLS-DA revealing the major discriminative end-points from in vivo silibinin treatment.
Figure 7
Figure 7
Silibinin targets proliferation, apoptosis, hypoxia, lipogenesis, and PSA level in 22Rv1 xenograft tissues. 22Rv1 xenografts were analyzed by IHC for Ki-67, cyclin D1, TUNEL, CD31, HIF-1α, FASN, ACC and PSA. Percentage of Ki-67, cyclin D1, TUNEL, HIF-1α and microvessel density (CD31 positive microvessel) were measured at five arbitrarily selected fields from each tumor at 400× magnification. Immunoreactivity for FASN, ACC and PSA was analyzed in 5 random areas for each tumor tissue and was scored as 0+ (no staining), 1+ (weak staining), 2+ (moderate staining), 3+ (strong staining), 4+ (very strong staining). Each value in the bar diagram is mean ± SEM of 10–12 xenografts. *, p ≤ 0.001

Similar articles

Cited by

References

    1. Siegel RL, Miller KD, Jemal A. Cancer statistics, 2016. CA Cancer J Clin. 2016;66:7–30. - PubMed
    1. Fraga A, Ribeiro R, Principe P, Lopes C, Medeiros R. Hypoxia and Prostate Cancer Aggressiveness: A Tale With Many Endings. Clin Genitourin Cancer. 2015;13:295–301. - PubMed
    1. Ranasinghe WK, Xiao L, Kovac S, et al. The role of hypoxia-inducible factor 1alpha in determining the properties of castrate-resistant prostate cancers. PLoS One. 2013;8:e54251. - PMC - PubMed
    1. Lu X, Kang Y. Hypoxia and hypoxia-inducible factors: master regulators of metastasis. Clin Cancer Res. 2010;16:5928–5935. - PMC - PubMed
    1. Ragnum HB, Vlatkovic L, Lie AK, et al. The tumour hypoxia marker pimonidazole reflects a transcriptional programme associated with aggressive prostate cancer. Br J Cancer. 2015;112:382–390. - PMC - PubMed

MeSH terms