. 2016 Sep 13;7(37):60245-60269.
doi: 10.18632/oncotarget.11197.

Sensitivity to PRIMA-1MET is associated with decreased MGMT in human glioblastoma cells and glioblastoma stem cells irrespective of p53 status

Affiliations

Sensitivity to PRIMA-1MET is associated with decreased MGMT in human glioblastoma cells and glioblastoma stem cells irrespective of p53 status

Mariia Patyka et al. Oncotarget. .

Abstract

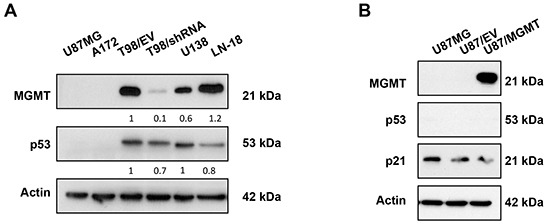
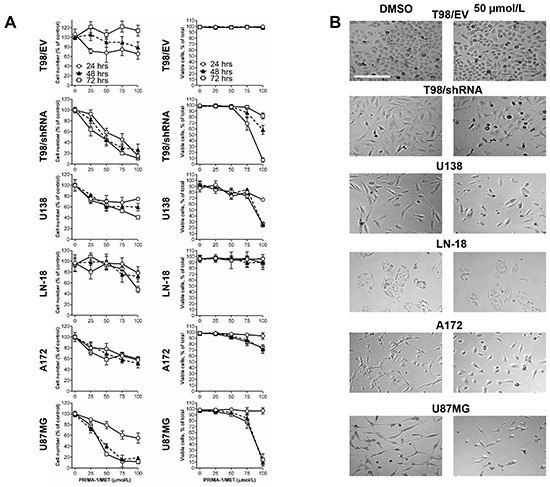
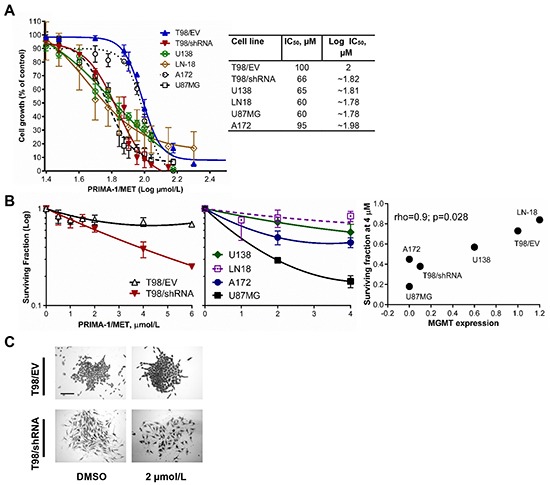
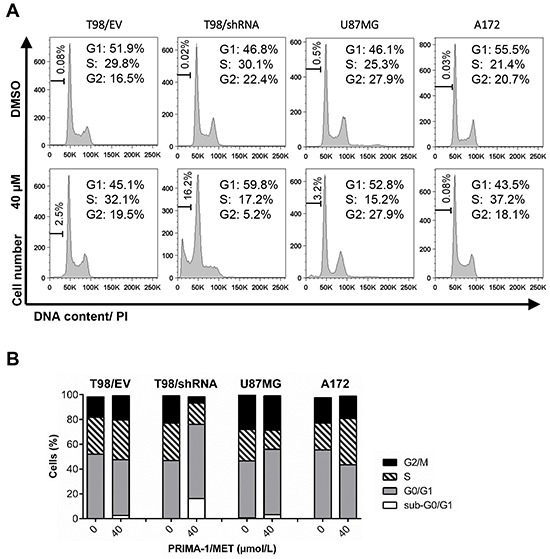
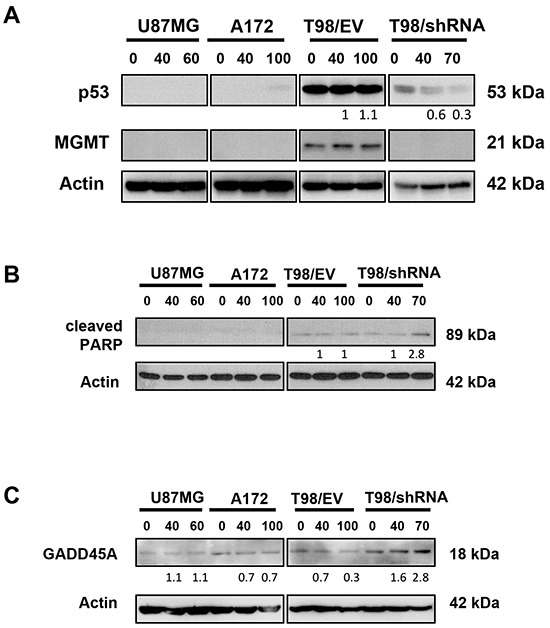
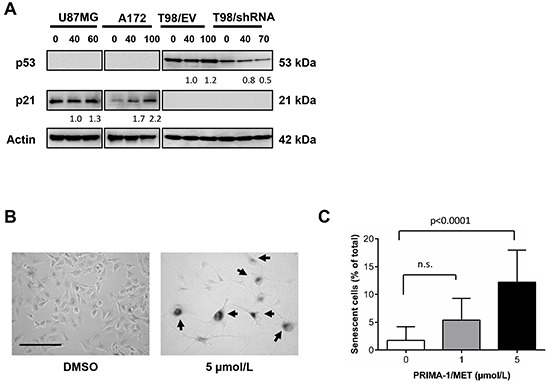
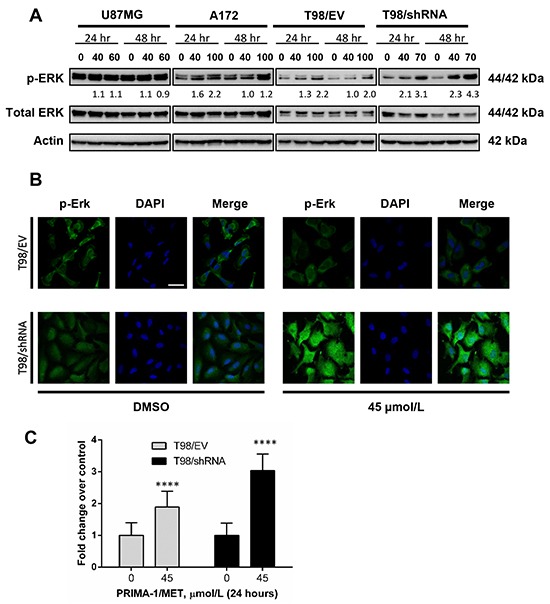
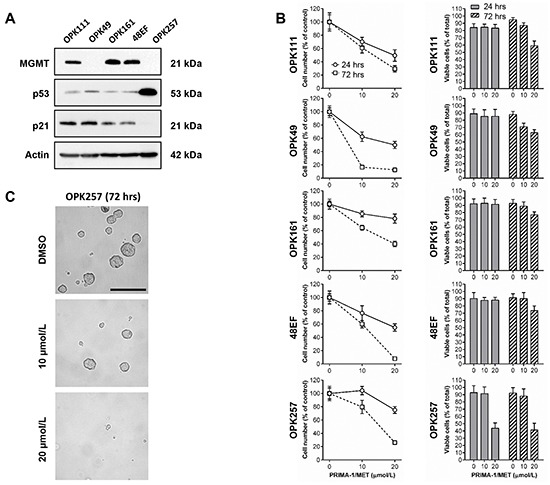
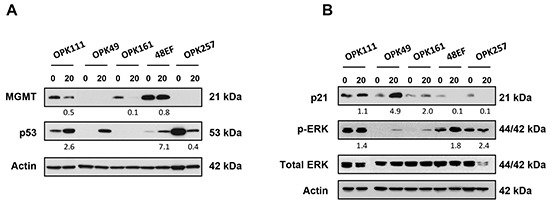
Alterations of the TP53 tumor suppressor gene occur in ~30% of primary glioblastoma (GBM) with a high frequency of missense mutations associated with the acquisition of oncogenic "gain-of-function" (GOF) mutant (mut)p53 activities. PRIMA-1MET/APR-246, emerged as a promising compound to rescue wild-type (wt)p53 function in different cancer types. Previous studies suggested the role of wtp53 in the negative regulation of the DNA repair protein O6-methylguanine-DNA methyltransferase (MGMT), a major determinant in resistance to therapy in GBM treatment. The potential role of MGMT in expression of p53 and the efficacy of PRIMA-1MET with respect to TP53 status and expression of MGMT in GBM remain unknown. We investigated response to PRIMA-1MET of wtp53/MGMT-negative (U87MG, A172), mutp53/MGMT-positive U138, LN-18, T98/Empty vector (T98/EV) and its isogenic MGMT/shRNA gene knockdown counterpart (T98/shRNA). We show that MGMT silencing decreased expression of mutp53/GOF in T98/shRNA. PRIMA-1MET further cleared T98/shRNA cells of mutp53, decreased proliferation and clonogenic potential, abrogated the G2 checkpoint control, increased susceptibility to apoptotic cell death, expression of GADD45A and sustained expression of phosphorylated Erk1/2. PRIMA-1MET increased expression of p21 protein in U87MG and A172 and promoted senescence in U87MG cell line. Importantly, PRIMA-1MET decreased relative cell numbers, disrupted the structure of neurospheres of patient-derived GBM stem cells (GSCs) and enabled activation of wtp53 with decreased expression of MGMT in MGMT-positive GSCs or decreased expression of mutp53. Our findings highlight the cell-context dependent effects of PRIMA-1MET irrespective of p53 status and suggest the role of MGMT as a potential molecular target of PRIMA-1MET in MGMT-positive GSCs.

Keywords: MGMT; PRIMA-1MET/APR-246; glioblastoma; glioblastoma stem cells; p53 mutation.


Conflict of interest statement

CONFLICTS OF INTEREST

The authors declare no conflict of interest.

Figures

Figure 1
Figure 1. MGMT silencing decreased mutp53 protein levels in mutp53 GBM cell lines isogenic for MGMT
A. Western blotting analysis of the effect of MGMT silencing on expression of p53. Expression of MGMT and p53 in lysates of U87MG, A172, T98G transfected with empty vector control (T98/EV) and shRNA-mediated knockdown of endogenous MGMT (T98/shRNA), as well as U138 and LN-18 GBM cell lines. B. Western blotting analysis of expression of MGMT, p53 and p21 in U87MG, U87/EV and U87/MGMT. Actin was used as a loading control. The density of MGMT and p53 bands was normalized to that of T98/EV.
Figure 2
Figure 2. PRIMA-1MET reduced relative cell number of GBM cell lines irrespective of p53 status
A. Analysis of the cytotoxic effect of PRIMA-1MET on T98/EV, T98/shRNA, U138, LN-18, A172 and U87MG GBM cell lines using trypan blue exclusion assay and automated cell counting to determine the percentage of relative number of cells in PRIMA-1MET-treated conditions relative to DMSO control at each time point (24, 48 or 72 hours following initiation of a 24-hour treatment with PRIMA-1MET) (left) and the ratio of viable cells (% relative to total cell number in each experimental condition) (right) in the indicated cell lines. Data on graphs represent the mean values ± SD and are representative of at least three independent experiments. B. Representative micrographs of GBM cells (original magnification 100X) treated with PRIMA-1MET (50 μM, 24 hours) or DMSO control. Scale bar = 250 μm.
Figure 3
Figure 3. PRIMA-1MET decreased proliferation and clonogenic potential of GBM cell lines with different MGMT levels and p53 status
A. Growth-inhibitory effects examined by MTT assay after incubation of T98/EV, T98/shRNA, U138, LN-18, A172 and U87MG GBM cell lines for 24 hours with increasing doses of PRIMA-1MET (10-200 μM) and additional 24 hours in a drug-free medium. Concentration of PRIMA-1MET is on a log10 scale. Graphs represent mean values ± SD from at least three independent experiments performed in triplicate. The resulting IC50 values are shown in the table. B. Colony formation assay results for T98/EV, T98/shRNA (left), LN-18, U138, A172 and U87MG (center) GBM cell lines - the number of colonies (more than 50 cells) was counted and surviving fraction was calculated 8-14 days after treatment with the indicated concentrations of PRIMA-1MET for 24 hours and further incubation in a drug-free medium. Surviving fraction (Y axis, log-scale) was normalized to plating efficiency of the corresponding DMSO controls. Results are means ± SD for at least three independent experiments performed in triplicate. Correlation between MGMT protein levels (from Table 1) and surviving fraction of T98/EV, T98/shRNA, LN-18, U138, A172 and U87MG GBM cell lines (right) treated with 4 μM PRIMA-1MET. C. Representative micrographs of T98/EV and T98/shRNA cell colonies stained with methylene blue 7 days following 24-hour treatment with 2 μM PRIMA-1MET (original magnification 100X). Scale bar = 250 μm.
Figure 4
Figure 4. PRIMA-1MET induced changes in cell cycle progression in GBM cells with silenced MGMT
A. Representative histogram plots of cell cycle distribution in T98/EV, T98/shRNA, U87MG and A172 GBM cell lines stained with propidium iodide (PI) at 24 hours following initiation of treatment with 40 μM PRIMA-1MET or DMSO and analyzed by flow cytometry. B. Bar graphs illustrate results of cell cycle analysis shown in (A), indicating the percentage of cells in sub-G0/G1, G0/G1, S, and G2/M cell cycle phases after treatment with 40 μM PRIMA-1MET or DMSO.
Figure 5
Figure 5. PRIMA-1MET decreased expression of mutp53 and increased cleaved PARP-1 and GADD45A in GBM cells with MGMT knockdown
Western blotting analysis of expression of MGMT and p53 (A) cleaved form of PARP-1 (89 kDa) (B) and GADD45A (C) in U87MG, A172, T98/EV and T98/shRNA GBM cell lines following 24-hour treatment with 40 μM (common dose) or the concentration corresponding to IC50 value of PRIMA-1MET in each cell line. Actin was used as a loading control. The density of the bands was normalized to that of DMSO controls (taken as 100%).
Figure 6
Figure 6. PRIMA-1MET treatment increased p21 and senescent phenotype in wtp53 MGMT-negative GBM cells
A. Western blotting analysis of expression of p53 and p21 in U87MG, A172, T98/EV and T98/shRNA GBM cell lines following 24-hour treatment with 40 μM (common dose) or the concentration corresponding to IC50 value of PRIMA-1MET in each cell line. Actin was used as a loading control. The density of the bands was normalized to that of DMSO controls (taken as 100%). B. Representative micrographs of senescence-associated β-galactosidase (SA-β-gal)-positive U87MG cells 6 days after the initiation of treatment with 5 μM PRIMA-1MET (original magnification 200X). Arrows show senescent cells. Scale bar = 200 μm. C. Percentage of SA-β-gal-positive U87MG cells 6 days after the initiation of treatment with 1 or 5 μM PRIMA-1MET. Results are means ± SD; total number of cells counted in each condition > 400. P-value for each condition compared to DMSO control is shown; n.s. – not significant.
Figure 7
Figure 7. PRIMA-1MET modulated expression and distribution of phosphorylated forms of Erk1/2 in GBM cell lines
A. Western blot analysis showing expression of phosphorylated forms of Erk1/2 (Thr202/Tyr204) in U87MG, A172, T98/EV and T98/shRNA GBM cell lines at 24 or 48 hours following initiation of PRIMA-1MET treatment with 40 μM (common dose) or the concentration corresponding to IC50 value of PRIMA-1MET in each cell line (actin used as a loading control). The density of the bands was normalized to that of DMSO controls (taken as 100%). B. Immunofluorescence staining and confocal microscopy analysis of T98/EV and T98/shRNA cells to assess intensity and localization of the phosphorylated forms of Erk1/2 at 24 hours following initiation of treatment with 45 μM PRIMA-1MET (45 μM is ~ IC20 for T98/shRNA and < IC10 for T98/EV) (original magnification 400X). Scale bar = 50 μm. C. Fold-changes in expression of the phosphorylated forms of Erk1/2 in T98/EV and T98/shRNA GBM cells at 24 hours following initiation of treatment with 45 μM PRIMA-1MET as assessed by immunofluorescent staining using ImageJ software. Results are means ± SD for representative of at least three independent experiments. Total number of cells analyzed in each condition of experiment > 40 cells. ****, statistically significant difference (p < 0.0001) compared to DMSO control.
Figure 8
Figure 8. PRIMA-1MET decreased relative cell number of GSCs irrespective of p53 status
A. Western blotting analysis showing expression of MGMT, p53 and p21 in OPK111, OPK49, OPK161, 48EF and OPK257 GSCs. Actin was used as a loading control. B. Analysis of the cytotoxic effect of PRIMA-1MET (10 or 20 μM) on OPK111, OPK49, OPK161, 48EF and OPK257 GSCs using trypan blue exclusion assay and automated cell counting to determine the percentage of relative number of cells in PRIMA-1MET-treated conditions relative to DMSO control at each time point (24 or 72 hours following initiation of a 24-hour treatment with PRIMA-1MET) (left) and the ratio of viable cells (% relative to total cell number in each experimental condition) (right) in the indicated cell lines. Data on graphs represent the mean values ± SD. C. Representative micrographs of OPK257 GSCs (original magnification 200X) treated with PRIMA-1MET (10 or 20 μM) or DMSO control at 72-hour time point. Scale bar = 200 μm.
Figure 9
Figure 9. PRIMA-1MET modulated expression of wt and mutp53, MGMT, p21 and phosphorylated forms of Erk1/2 in GSCs
Western blotting analysis of expression of MGMT, p53 (A) p21 and phosphorylated forms of Erk1/2 (Thr202/Tyr204) (B) in OPK111, OPK49, OPK161, 48EF and OPK257 GSCs following 24-hour treatment with 20 μM PRIMA-1MET. Actin was used as a loading control. The density of the bands was normalized to that of DMSO controls (taken as 100%).

Similar articles

Cited by

References

    1. Goodenberger ML, Jenkins RB. Genetics of adult glioma. Cancer Genet. 2012;205:613–621. - PubMed
    1. Dolecek TA, Propp JM, Stroup NE, Kruchko C. CBTRUS statistical report: primary brain and central nervous system tumors diagnosed in the United States in 2005-2009. Neuro Oncol. 2012;14(Suppl 5):v1–49. - PMC - PubMed
    1. Louis DN, Perry A, Reifenberger G, von Deimling A, Figarella-Branger D, Cavenee WK, Ohgaki H, Wiestler OD, Kleihues P, Ellison DW. The 2016 World Health Organization Classification of Tumors of the Central Nervous System: a summary. Acta Neuropathol. 2016;131:803–820. - PubMed
    1. Zhang J, Stevens M, Bradshaw T. Temozolomide: mechanisms of action, repair and resistance. Curr Mol Pharmacol. 2012;5:102–114. - PubMed
    1. Anton K, Baehring JM, Mayer T. Glioblastoma multiforme: overview of current treatment and future perspectives. Hematol Oncol Clin North Am. 2012;26:825–853. - PubMed

MeSH terms