Focusing light through biological tissue and tissue-mimicking phantoms up to 9.6 cm in thickness with digital optical phase conjugation
- PMID: 27533439
- PMCID: PMC4982119
- DOI: 10.1117/1.JBO.21.8.085001
Focusing light through biological tissue and tissue-mimicking phantoms up to 9.6 cm in thickness with digital optical phase conjugation
Abstract
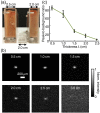
Optical phase conjugation (OPC)-based wavefront shaping techniques focus light through or within scattering media, which is critically important for deep-tissue optical imaging, manipulation, and therapy. However, to date, the sample thickness in OPC experiments has been limited to only a few millimeters. Here, by using a laser with a long coherence length and an optimized digital OPC system that can safely deliver more light power, we focused 532-nm light through tissue-mimicking phantoms up to 9.6 cm thick, as well as through ex vivo chicken breast tissue up to 2.5 cm thick. Our results demonstrate that OPC can be achieved even when photons have experienced on average 1000 scattering events. The demonstrated penetration of nearly 10 cm (∼100 transport mean free paths) has never been achieved before by any optical focusing technique, and it shows the promise of OPC for deep-tissue noninvasive optical imaging, manipulation, and therapy.
Figures


Similar articles
-
High-speed alignment optimization of digital optical phase conjugation systems based on autocovariance analysis in conjunction with orthonormal rectangular polynomials.J Biomed Opt. 2018 Aug;24(3):1-11. doi: 10.1117/1.JBO.24.3.031004. J Biomed Opt. 2018. PMID: 30156064 Free PMC article.
-
Ballistic imaging of biological media with collimated illumination and focal plane detection.J Biomed Opt. 2015 Jul;20(7):76006. doi: 10.1117/1.JBO.20.7.076006. J Biomed Opt. 2015. PMID: 26172614
-
Optical information transmission through complex scattering media with optical-channel-based intensity streaming.Nat Commun. 2021 Apr 23;12(1):2411. doi: 10.1038/s41467-021-22692-1. Nat Commun. 2021. PMID: 33893304 Free PMC article.
-
Wavefront shaping: A versatile tool to conquer multiple scattering in multidisciplinary fields.Innovation (Camb). 2022 Aug 2;3(5):100292. doi: 10.1016/j.xinn.2022.100292. eCollection 2022 Sep 13. Innovation (Camb). 2022. PMID: 36032195 Free PMC article. Review.
-
Wavefront Shaping Concepts for Application in Optical Coherence Tomography-A Review.Sensors (Basel). 2020 Dec 9;20(24):7044. doi: 10.3390/s20247044. Sensors (Basel). 2020. PMID: 33316998 Free PMC article. Review.
Cited by
-
Focusing light inside dynamic scattering media with millisecond digital optical phase conjugation.Optica. 2017 Feb;4(2):280-288. doi: 10.1364/OPTICA.4.000280. Epub 2017 Feb 20. Optica. 2017. PMID: 28815194 Free PMC article.
-
Implementation of digital optical phase conjugation with embedded calibration and phase rectification.Sci Rep. 2019 Feb 7;9(1):1537. doi: 10.1038/s41598-018-38326-4. Sci Rep. 2019. PMID: 30733574 Free PMC article.
-
Deep tissue optical focusing and optogenetic modulation with time-reversed ultrasonically encoded light.Sci Adv. 2017 Dec 8;3(12):eaao5520. doi: 10.1126/sciadv.aao5520. eCollection 2017 Dec. Sci Adv. 2017. PMID: 29226248 Free PMC article.
-
Time-reversed magnetically controlled perturbation (TRMCP) optical focusing inside scattering media.Sci Rep. 2018 Feb 13;8(1):2927. doi: 10.1038/s41598-018-21258-4. Sci Rep. 2018. PMID: 29440682 Free PMC article.
-
Focusing light inside scattering media with magnetic-particle-guided wavefront shaping.Optica. 2017 Nov 20;4(11):1337-1343. doi: 10.1364/OPTICA.4.001337. Optica. 2017. PMID: 29623290 Free PMC article.
References
-
- Wang L. V., Wu H., Biomedical Optics: Principles and Imaging, Wiley-Interscience, Hoboken, New Jersey: (2007).
Publication types
MeSH terms
Grants and funding
LinkOut - more resources
Full Text Sources
Other Literature Sources

