

Role of mir-15a/16-1 in early B cell development in a mouse model of chronic lymphocytic leukemia
- PMID: 27533467
- PMCID: PMC5308631
- DOI: 10.18632/oncotarget.11290
Role of mir-15a/16-1 in early B cell development in a mouse model of chronic lymphocytic leukemia
Abstract
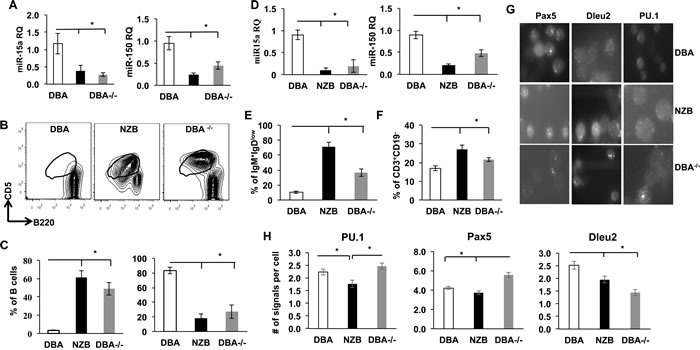
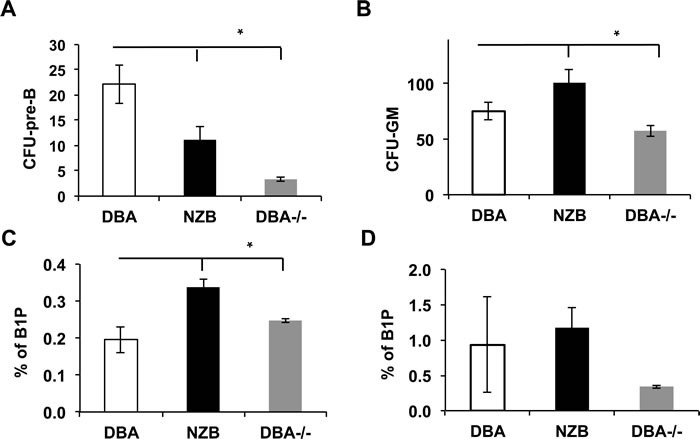
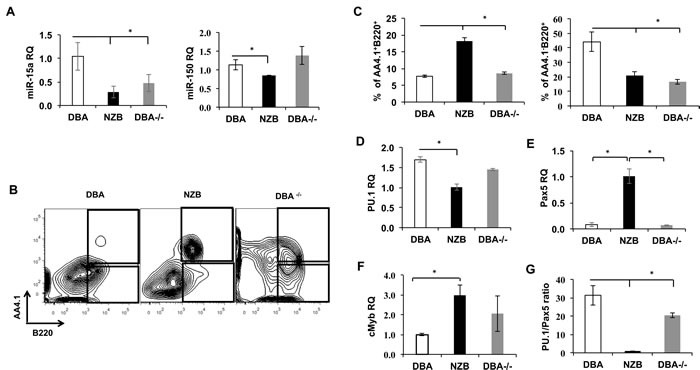
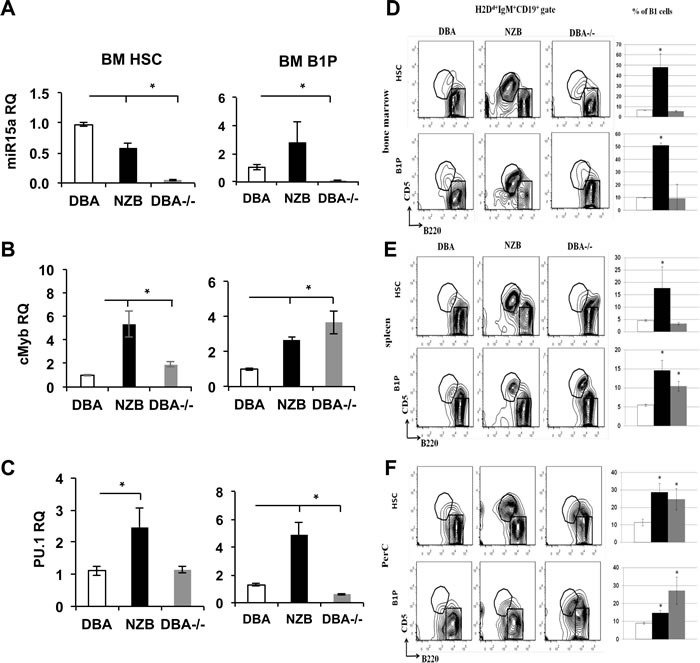
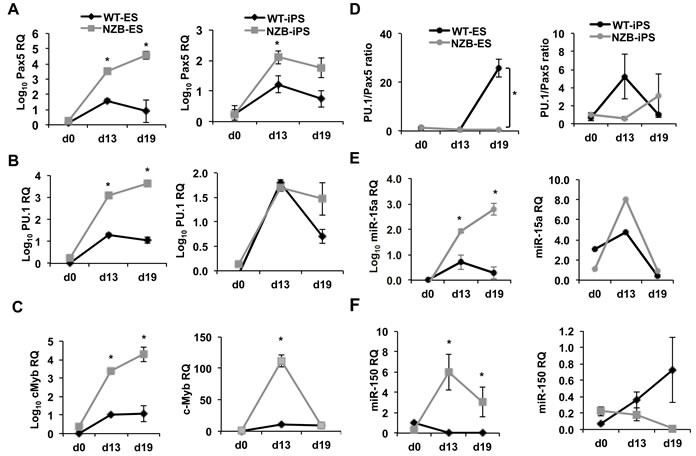
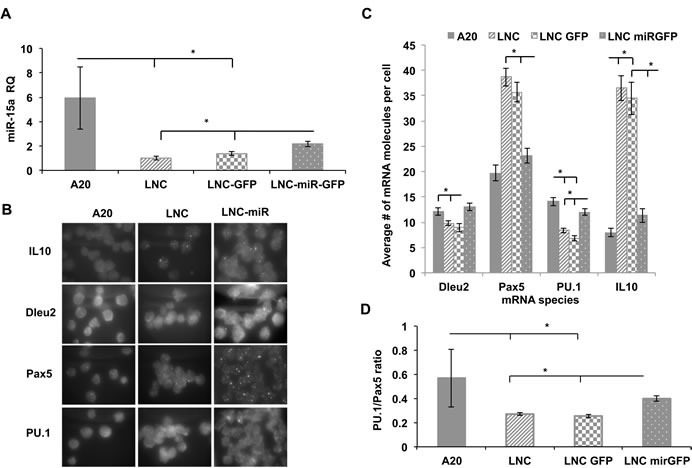
In both human chronic lymphocytic leukemia (CLL) and the New Zealand Black (NZB) murine model of CLL, decreased levels of microRNAs miR-15a/16 play an important role in the disease. Here we investigate the effects of this microRNA on early steps of B cell development and the capacity of miR-15a-deficient hematopoietic stem cells (HSC) and B1 progenitor cells (B1P) to reproduce CLL-like phenotype both in vitro and in vivo. Our results demonstrate that both miR-15a deficient HSC and B1P cells are capable of repopulating irradiated recipients and produce higher numbers of B1 cells than sources with normal miR-15a/16 levels. Furthermore, induced pluripotent stem (iPS) cells derived for the first time from NZB mice, provided insights into the B cell differentiation roadblock inherent in this strain. In addition, exogenously delivered miR-15a into the NZB derived B cell line provided valuable clues into novel targets such as Mmp10 and Mt2. Our data supports the hypothesis that miR-15a/16 deficient stem cells and B1Ps experience a maturation blockage, which contributes to B1 cells bias in development. This work will help understand the role of miR-15a in early events of CLL and points to B1P cells as potential cells of origin for this incurable disease.
Keywords: B1 progenitors; cancer stem cells; chronic lymphocytic leukemia; induced pluripotent stem cells; microRNAs.
Conflict of interest statement
The authors declare no competing financial interests.
Figures
Similar articles
-
Alterations in the mir-15a/16-1 Loci Impairs Its Processing and Augments B-1 Expansion in De Novo Mouse Model of Chronic Lymphocytic Leukemia (CLL).PLoS One. 2016 Mar 9;11(3):e0149331. doi: 10.1371/journal.pone.0149331. eCollection 2016. PLoS One. 2016. PMID: 26959643 Free PMC article.
-
Therapeutic implications of activation of the host gene (Dleu2) promoter for miR-15a/16-1 in chronic lymphocytic leukemia.Oncogene. 2014 Jun 19;33(25):3307-15. doi: 10.1038/onc.2013.291. Epub 2013 Sep 2. Oncogene. 2014. PMID: 23995789 Free PMC article.
-
Correcting miR-15a/16 genetic defect in New Zealand Black mouse model of CLL enhances drug sensitivity.Mol Cancer Ther. 2009 Sep;8(9):2684-92. doi: 10.1158/1535-7163.MCT-09-0127. Epub 2009 Sep 1. Mol Cancer Ther. 2009. PMID: 19723889
-
Evaluation of MiR-15a and MiR-16-1 as prognostic biomarkers in chronic lymphocytic leukemia.Biomed Pharmacother. 2017 Aug;92:864-869. doi: 10.1016/j.biopha.2017.05.144. Epub 2017 Jun 6. Biomed Pharmacother. 2017. PMID: 28599250 Review.
-
All you need is a Mir-acle: the role of nontranslated RNAs in the suppression of B cell chronic lymphocytic leukemia.Cancer Cell. 2010 Jan 19;17(1):3-4. doi: 10.1016/j.ccr.2009.12.029. Cancer Cell. 2010. PMID: 20129242 Review.
Cited by
-
Harnessing the power of proteins in modulation of miRNAs for targeting Iron deficiency Anemia: Opinion for future implications and strategies.Front Nutr. 2025 Jan 27;12:1535498. doi: 10.3389/fnut.2025.1535498. eCollection 2025. Front Nutr. 2025. PMID: 39931366 Free PMC article. Review.
-
MicroRNAs in Autoimmunity and Hematological Malignancies.Int J Mol Sci. 2018 Oct 12;19(10):3139. doi: 10.3390/ijms19103139. Int J Mol Sci. 2018. PMID: 30322050 Free PMC article. Review.
-
Quercetin shortened survival of radio-resistant B-1 cells in vitro and in vivo by restoring miR15a/16 expression.Oncotarget. 2021 Feb 16;12(4):355-365. doi: 10.18632/oncotarget.27883. eCollection 2021 Feb 16. Oncotarget. 2021. PMID: 33659046 Free PMC article.
-
Age-related accumulation of B-1 cell progenitors in mice reflects changes in miR15a/16-1 expression and radioresistance capacity.Exp Hematol Oncol. 2023 Mar 6;12(1):24. doi: 10.1186/s40164-023-00390-6. Exp Hematol Oncol. 2023. PMID: 36879336 Free PMC article.
-
The Promising Role of Non-Coding RNAs as Biomarkers and Therapeutic Targets for Leukemia.Genes (Basel). 2023 Jan 3;14(1):131. doi: 10.3390/genes14010131. Genes (Basel). 2023. PMID: 36672872 Free PMC article. Review.
References
-
- Dillman RO. Immunophenotyping of chronic lymphoid leukemias. Journal of clinical oncology. 2008;26:1193–1194. - PubMed
-
- Hallek M, Cheson BD, Catovsky D, Caligaris-Cappio F, Dighiero G, Dohner H, Hillmen P, Keating MJ, Montserrat E, Rai KR, Kipps TJ, International Workshop on Chronic Lymphocytic L Guidelines for the diagnosis and treatment of chronic lymphocytic leukemia: a report from the International Workshop on Chronic Lymphocytic Leukemia updating the National Cancer Institute-Working Group 1996 guidelines. Blood. 2008;111:5446–5456. - PMC - PubMed
-
- Calin GA, Cimmino A, Fabbri M, Ferracin M, Wojcik SE, Shimizu M, Taccioli C, Zanesi N, Garzon R, Aqeilan RI, Alder H, Volinia S, Rassenti L, et al. MiR-15a and miR-16-1 cluster functions in human leukemia. Proceedings of the National Academy of Sciences of the United States of America. 2008;105:5166–5171. - PMC - PubMed
-
- Klein U, Lia M, Crespo M, Siegel R, Shen Q, Mo T, Ambesi-Impiombato A, Califano A, Migliazza A, Bhagat G, Dalla-Favera R. The DLEU2/miR-15a/16-1 cluster controls B cell proliferation and its deletion leads to chronic lymphocytic leukemia. Cancer cell. 2010;17:28–40. - PubMed
MeSH terms
Substances
Grants and funding
LinkOut - more resources
Full Text Sources
Other Literature Sources
Molecular Biology Databases
