. 2016 Sep 15;197(6):2390-9.
doi: 10.4049/jimmunol.1600702. Epub 2016 Aug 17.

Blood-Borne Lipopolysaccharide Is Rapidly Eliminated by Liver Sinusoidal Endothelial Cells via High-Density Lipoprotein

Affiliations

Blood-Borne Lipopolysaccharide Is Rapidly Eliminated by Liver Sinusoidal Endothelial Cells via High-Density Lipoprotein

Zhili Yao et al. J Immunol. .

Abstract

During Gram-negative bacterial infections, excessive LPS induces inflammation and sepsis via action on immune cells. However, the bulk of LPS can be cleared from circulation by the liver. Liver clearance is thought to be a slow process mediated exclusively by phagocytic resident macrophages, Kupffer cells (KC). However, we discovered that LPS disappears rapidly from the circulation, with a half-life of 2-4 min in mice, and liver eliminates about three quarters of LPS from blood circulation. Using microscopic techniques, we found that ∼75% of fluor-tagged LPS in liver became associated with liver sinusoidal endothelial cells (LSEC) and only ∼25% with KC. Notably, the ratio of LSEC-KC-associated LPS remained unchanged 45 min after infusion, indicating that LSEC independently processes the LPS. Most interestingly, results of kinetic analysis of LPS bioactivity, using modified limulus amebocyte lysate assay, suggest that recombinant factor C, an LPS binding protein, competitively inhibits high-density lipoprotein (HDL)-mediated LPS association with LSEC early in the process. Supporting the previous notion, 3 min postinfusion, 75% of infused fluorescently tagged LPS-HDL complex associates with LSEC, suggesting that HDL facilitates LPS clearance. These results lead us to propose a new paradigm of LSEC and HDL in clearing LPS with a potential to avoid inflammation during sepsis.


Figures

Fig 1
Fig 1. Rough LPS is cleared efficiently in WT BALB/c mice and liver is the major organ involved in clearance
We infused via the tail vein 488-LPS and then evaluated the clearance from peripheral blood. Panel A: The curve plots the percentage of 488-LPS in 10 μl of blood vs time by keeping time 0 as 100%. The LPS concentration at zero time is calculated as the dose divided by the blood volume. Panel B: The curve plots the percentage of fluorescence from 488-LPS in 10 μl of blood vs time by using the fluorescence from first time point namely 30 sec as 100%. Each data point represents mean percentage ± SD of three mice. Panel C and D: Organ distribution of 3H/14C LPS showing radioactivity in percentage of infused dose (panel C) and radioactivity in dpm (panel D) in various organs. The data is from 3 different mice representing 3 experiments. Asterisks signify statistically significant differences, p<0.05, using Student’s t-test.
Fig 2
Fig 2. In liver, FITC-labelled rough LPS is distributed primarily to LSEC
Four color fluorescence microscopic image of liver from mice infused 1 minute earlier with 7.5 μg of FITC-LPS. a. DAPI showing cell nuclei (blue). b. Green puncta identify FITC-LPS particles. c. Rabbit IgG anti-MR mark LSEC.in red d. Magenta color defines the KC labelled with mab F4/80. e. Merged panels of a,b,c and d. f. Merged panel e plus Differential Interface Contrast (DIC) defining tissue structure including sinusoidal lumens. The bars in the panel d indicate 10 μm. The image presented here is a representative of 30 images of 3 different mice from 3 experiments, which are quantified in Fig 3.
Fig 3
Fig 3. Quantification validates predominant LSEC localization of LPS
Panel A and B. Quantification of FITC-LPS from 4-color fluorescence images similar to Fig 2 by measuring the total pixel area and the mean fluorescence intensity of green puncta associated with LSEC and KC markers. Panel C and D. Quantification of 488-LPS from 4-color fluorescence images similar to Fig S3, by measuring the total pixel area and the mean fluorescence intensity of green puncta associated with LSEC and KC markers. Panel A and C. The bar graphs show percentage of FITC-LPS/488-LPS ±SD from 3 different experiments. Panel B and D. The bar graph shows area × mean fluorescence intensity ± Standard deviation (SD) of FITC-LPS/488-LPS from 6 mice, 3 for FITC-LPS and 3 for 488-LPS from 3 different experiments. The area of tissue examined microscopically were 14 and 8 mm2, respectively for FITC-LPS and 488-LPS. Asterisks signify statistically significant differences, p<0.05, using Student’s t- test.
Fig 4
Fig 4. LSEC associated LPS is not taken up by KC
Quantification of FITC-LPS in mouse livers at 1, 15 and 45 min after infusion using 4-color fluorescence images similar to Fig 2, by measuring the total pixel area and the mean fluorescence intensity of green puncta associated with LSEC and KC markers. The bar graphs show relative percentage of FITC-LPS association ± SD, between LSEC and KC from each of 3 different mice from 3 different experiments for each time point. Lack of asterisk signify lack of any statistically significant differences P<0.05, using Student’s t- test.
Fig 5
Fig 5. LPS associated with LSEC does not bind to factor C at 1 min after infusion
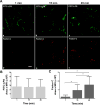
The biologically activity of FITC-LPS associated with LSEC was detected in vivo in liver tissue previously infused with FITC-LPS and fixed after 1, 15 and 45 min, using modified LAL assay with factor C and anti-factor C antibody. The green puncta identify FITC-LPS particles and the red puncta identifies the factor C binding to FITC-LPS. Panel A Quantification of FITC-LPS signal from 2-color fluorescence images, similar to Fig 5 is shown here. The total pixel area and the mean fluorescence intensity of green puncta were measured and plotted. Panel B. Quantification of factor-C binding signal from 2-color fluorescence images, similar to Fig 5 is shown here. The total pixel area and the mean fluorescence intensity of red puncta were measured and plotted. The bar graphs show the Area × Mean fluorescence intensity ± SD from each of 3 different mouse from 2 experiments. The area of tissue examined microscopically totaled 14 mm2. Asterisks signify statistically significant differences, p<0.05, using Student’s t- test.
Fig 6
Fig 6. FPLC of Superose-6 size exclusion elution profiles of LPS-HDL complex
Panel A: The FPLC profile shows the size exclusion chromatographic analysis of 488-LPS with 594-HDL. Panel A shows the elution profile of LPS-HDL complex before purification. Fractions of 17 to 26 from Panel A were collected and concentrated to achieve purified 488-LPS and 594 complexes. Panel B: Shows the elution profile of Alexa 488-LPS-Alexa 594-HDL complex from Superose 6 Increase 3.2/300 analytical column. The chromatogram shows the overlay of absorbance at UV 280 nm from HDL proteins and fluorescence emission spectra at 488 nm excitation from Alexa-488 LPS and 594 nm excitation from Alexa 594-labeled HDL. The data are representative of 3 independent preparations/experiments.
Fig 7
Fig 7. 488-LPS- 594-HDL complex localize chiefly to LSEC
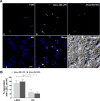
Panel A: Four color fluorescence microscopic image of liver from mice infused 3 minutes earlier with 488-LPS-594-HDL complex. a. Magenta color delineates the KC. b. Green puncta identify 488-LPS particles. c. Red puncta identifies 594-HDL. d. Blue color shows Rabbit IgG anti-MR marking LSEC. e. Merged panels a, b, c and d. f. panel e plus DIC defining tissue structure including sinusoidal lumens. The bars in the panel d column indicate 10 μm. Panel B: Quantification of Alexa 488-LPS and Alexa 594-HDL signal from 2-color fluorescence images, similar to panel A is shown here. The total pixel area and the mean fluorescence intensity of green puncta and red puncta were measured and plotted. The bar graphs show percentage and mean ± SD from each of 3 different experiments/mouse. The area of tissue examined microscopically totaled 8 mm2. Asterisks signify statistically significant differences, p<0.05, using Student’s t-test.
Fig 8
Fig 8
Schematic model for LPS inactivation by LSEC.

Similar articles

Cited by

References

    1. Park BS, Song DH, Kim HM, Choi B-S, Lee H, Lee J-O. The structural basis of lipopolysaccharide recognition by the TLR4–MD-2 complex. Nature. 2009;458:1191–1196. - PubMed
    1. Maeshima N, Fernandez RC. Recognition of lipid A variants by the TLR4-MD-2 receptor complex. Front Cell Infect Microbiol. 2013;3:3. - PMC - PubMed
    1. Freudenberg MA, Galanos C. Bacterial lipopolysaccharides: Structure, metabolism and mechanisms of action. Intern Rev Immunol. 1990;6:207–221. - PubMed
    1. Mathison JC, Ulevitch RJ. The Clearance, Tissue Distribution, and Cellular Localization of Intravenously Injected Lipopolysaccharide in Rabbits. J Immunol. 1979;123:2133–2143. - PubMed
    1. Shao B, Lu M, Katz SC, Varley AW, Hardwick J, Rogers TE, Ojogun N, Rockey DC, Dematteo RP, Munford RS. A host lipase detoxifies bacterial lipopolysaccharides in the liver and spleen. J Biol Chem. 2007;282:13726–13735. - PubMed

Publication types

MeSH terms