

Iodine in food- and dietary supplement-composition databases
- PMID: 27534627
- PMCID: PMC5004500
- DOI: 10.3945/ajcn.115.110064
Iodine in food- and dietary supplement-composition databases
Abstract
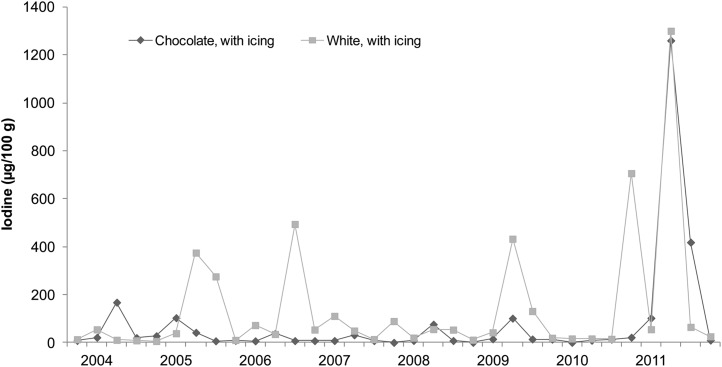
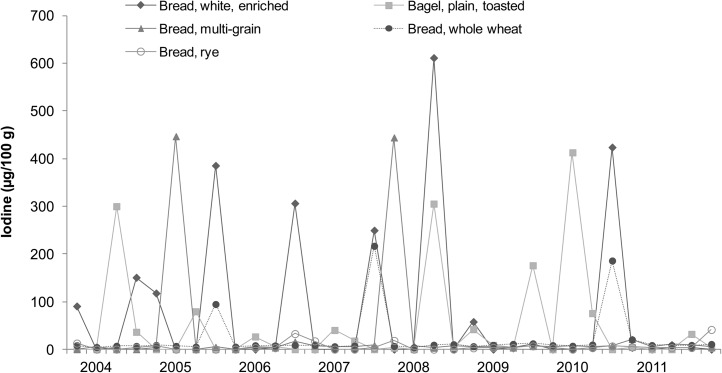
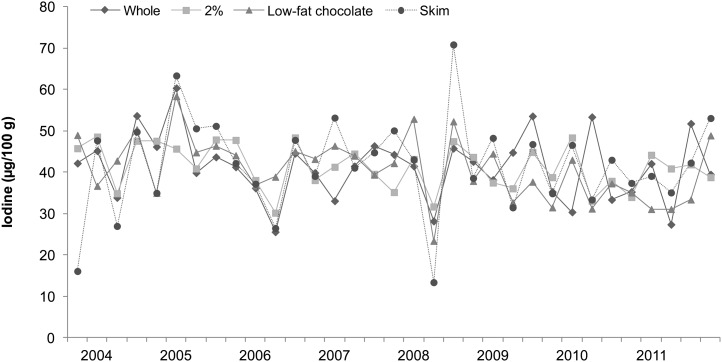
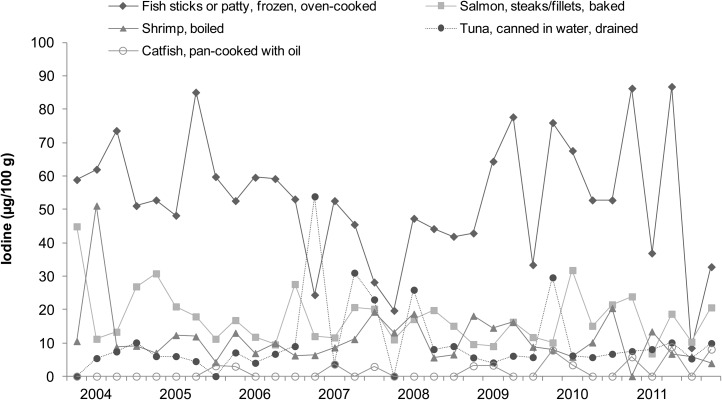
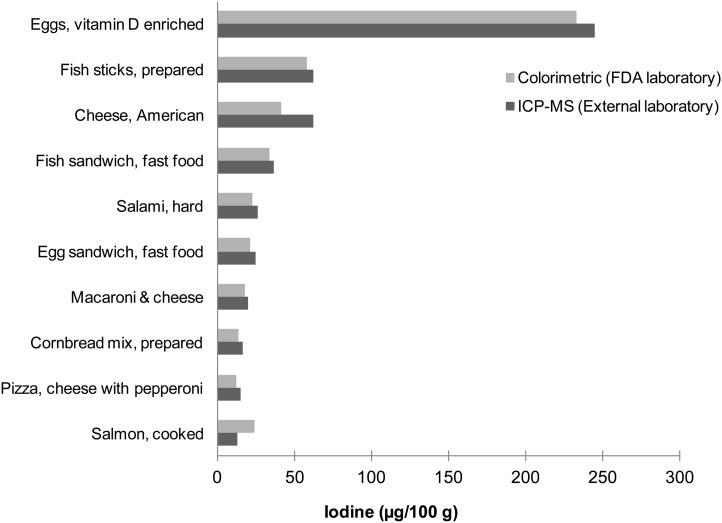
The US Food and Drug Administration (FDA) and the Nutrient Data Laboratory (NDL) of the USDA Agricultural Research Service have worked independently on determining the iodine content of foods and dietary supplements and are now harmonizing their efforts. The objective of the current article is to describe the harmonization plan and the results of initial iodine analyses accomplished under that plan. For many years, the FDA's Total Diet Study (TDS) has measured iodine concentrations in selected foods collected in 4 regions of the country each year. For more than a decade, the NDL has collected and analyzed foods as part of the National Food and Nutrient Analysis Program; iodine analysis is now being added to the program. The NDL recently qualified a commercial laboratory to conduct iodine analysis of foods by an inductively coupled plasma mass spectrometry (ICP-MS) method. Co-analysis of a set of samples by the commercial laboratory using the ICP-MS method and by the FDA laboratory using its standard colorimetric method yielded comparable results. The FDA recently reviewed historical TDS data for trends in the iodine content of selected foods, and the NDL analyzed samples of a limited subset of those foods for iodine. The FDA and the NDL are working to combine their data on iodine in foods and to produce an online database that can be used for estimating iodine intake from foods in the US population. In addition, the NDL continues to analyze dietary supplements for iodine and, in collaboration with the NIH Office of Dietary Supplements, to publish the data online in the Dietary Supplement Ingredient Database. The goal is to provide, through these 2 harmonized databases and the continuing TDS focus on iodine, improved tools for estimating iodine intake in population studies.
Keywords: DSID; FDA; NHANES; Total Diet Study; USDA.
© 2016 American Society for Nutrition.
Figures
References
-
- Delange F. The role of iodine in brain development. Proc Nutr Soc 2000;59:75–9. - PubMed
-
- Zimmermann MB. Iodine deficiency and excess in children: worldwide status in 2013. Endocr Pract 2013;19:839–46. - PubMed
-
- Whitehead DC. The distribution and transformations of iodine in the environment. Environ Int 1984;10:321–39.
MeSH terms
Substances
LinkOut - more resources
Full Text Sources
Other Literature Sources
Medical
