. 2016 Aug 18:6:32060.
doi: 10.1038/srep32060.

Hierarchical organization of functional connectivity in the mouse brain: a complex network approach

Affiliations

Hierarchical organization of functional connectivity in the mouse brain: a complex network approach

Giampiero Bardella et al. Sci Rep. .

Abstract

This paper represents a contribution to the study of the brain functional connectivity from the perspective of complex networks theory. More specifically, we apply graph theoretical analyses to provide evidence of the modular structure of the mouse brain and to shed light on its hierarchical organization. We propose a novel percolation analysis and we apply our approach to the analysis of a resting-state functional MRI data set from 41 mice. This approach reveals a robust hierarchical structure of modules persistent across different subjects. Importantly, we test this approach against a statistical benchmark (or null model) which constrains only the distributions of empirical correlations. Our results unambiguously show that the hierarchical character of the mouse brain modular structure is not trivially encoded into this lower-order constraint. Finally, we investigate the modular structure of the mouse brain by computing the Minimal Spanning Forest, a technique that identifies subnetworks characterized by the strongest internal correlations. This approach represents a faster alternative to other community detection methods and provides a means to rank modules on the basis of the strength of their internal edges.


Figures

Figure 1
Figure 1. Dendrogram and correlation matrix for the average brain, induced by the dissimilarity measure , with representing the correlation matrix averaged over the single subjects entries constituting our sample.
Figure 2
Figure 2. Empirical cumulative density function (CDF) of the correlations observed in average brain (blue trend) and CDF of a gaussian distribution whose means and standard deviations have been estimated through the maximum-of-the-likelihood prescription (red trend), which allows us to evaluate them as the sample mean and the sample standard deviation of the set of values .
Figure 3
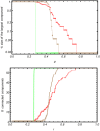
Figure 3. Comparison between the usual percolation analysis (upper panel) and our modified percolation analysis (bottom panel) run on the average brain (red trend), on a randomized version of it, retaining the same empirical distribution of correlations (brown trend) and on the ensemble-averaged matrix (green trend).
While the usual percolation analysis detects a hierarchical modular structure even on the null model, thus making it difficult to asses the statistical significance of the observed patterns, our modified percolation analysis enables discrimination between the real and the random cases.
Figure 4
Figure 4. Each group of areas detected by our percolation analysis in correspondence of a given correlation value is composed by many sub-modules, whose presence is evidenced by raising the threshold value.
A clear example is provided by the blue area detected for rth = 0.51, comprising the anterio-dorsal hippocampus, the dentate gyrus and the posterior dentate gyrus - i.e. areas 3, 4, 19, 20, 35, 36. Upon raising the threshold to rth = 0.52, two subgroups appear, composed respectively by the right and left parts - i.e. 3, 19, 35 and 4, 20, 36 - of the aforementioned areas (evidenced in blue and purple). Further raising the threshold to rth = 0.6, the two subgroups reveal a core structure defined by the pairs 19, 35 and 20, 36. This finding confirms the hierarchical character of the mouse brain modular structure. See also the map of the neuroanatomical ROI in the SI.
Figure 5
Figure 5. In order to assess the statistical significance of the results of our modified percolation analysis, a test is needed.
Left panel represents the test statistics we have chosen: the slope of the percolation plot of both the average brain (red trend) and of a randomized version of it, retaining the same empirical distribution of correlations (brown trend). Right panel: ensemble distribution of our test statistics; the red point represents the (statistically significant) observed value of the latter.
Figure 6
Figure 6. Result of the MSF algorithm mapped into the average mouse brain areas.
The algorithm works by first sorting the observed correlations in decreasing order and then linking pairs of areas sequentially, with the only limitation that each new link must connect at least one previously disconnected area. Colors correspond to the average correlation value of the links defining each tree composing the forest. See also the map of the neuroanatomical ROI in the SI.
Figure 7
Figure 7. MST of our average mouse brain.
The MST has been built by connecting the trees of the MSF, with the only limitation that any newly-added link must connect a pair of previously-disconnected trees: a consequence of the MST algorithm is that the correlations within the trees are, on average, higher than the correlations between the trees. The MST also allows us to distinguish between connector and provincial areas. See also the map of the neuroanatomical ROI in the SI.

References

    1. van den Heuvel M. P. & Hulshoff Pol H. E.. Exploring the brain network: a review on resting-state fMRI functional connectivity. European Neuropsychopharmacology 20, 519–534 (2010). - PubMed
    1. Yao Z., Xie Y., Moore P. & Zheng J.. A review of structural and functional brain networks: small world and atlas. Brain Informatics 2(9), 45–52, 10.1007/s40708-015-0009-z (2015) (Date of access: 26/04/2016). - DOI - PMC - PubMed
    1. Bullmore E. & Sporns O.. Complex brain networks: graph theoretical analysis of structural and functional systems. Nature Reviews Neuroscience 10, 186–198 (2010) (Date of access: 26/04/2016). - PubMed
    1. Sporns O. & Betzel R.. Modular brain networks. Annual Review of Psychology 67(19), 1–28 (2016). - PMC - PubMed
    1. Nicolini C. & Bifone A.. Modular structure of brain networks: breaking the resolution limit by surprise. Scientific Reports 6(19250), 10.1038/srep19250 (2016) (Date of access: 26/04/2016). - DOI - PMC - PubMed

Publication types