. 2016 Dec;40(12):1864-1874.
doi: 10.1038/ijo.2016.146. Epub 2016 Aug 18.

Mitochondria-targeted dodecyltriphenylphosphonium (C12TPP) combats high-fat-diet-induced obesity in mice

Affiliations

Mitochondria-targeted dodecyltriphenylphosphonium (C12TPP) combats high-fat-diet-induced obesity in mice

A V Kalinovich et al. Int J Obes (Lond). 2016 Dec.

Abstract

Background: A membrane-penetrating cation, dodecyltriphenylphosphonium (C12TPP), facilitates the recycling of fatty acids in the artificial lipid membrane and mitochondria. C12TPP can dissipate mitochondrial membrane potential and may affect total energy expenditure and body weight in animals and humans.

Methods: We investigated the metabolic effects of C12TPP in isolated brown-fat mitochondria, brown adipocyte cultures and mice in vivo. Experimental approaches included the measurement of oxygen consumption, carbon dioxide production, western blotting, magnetic resonance imaging and bomb calorimetry.

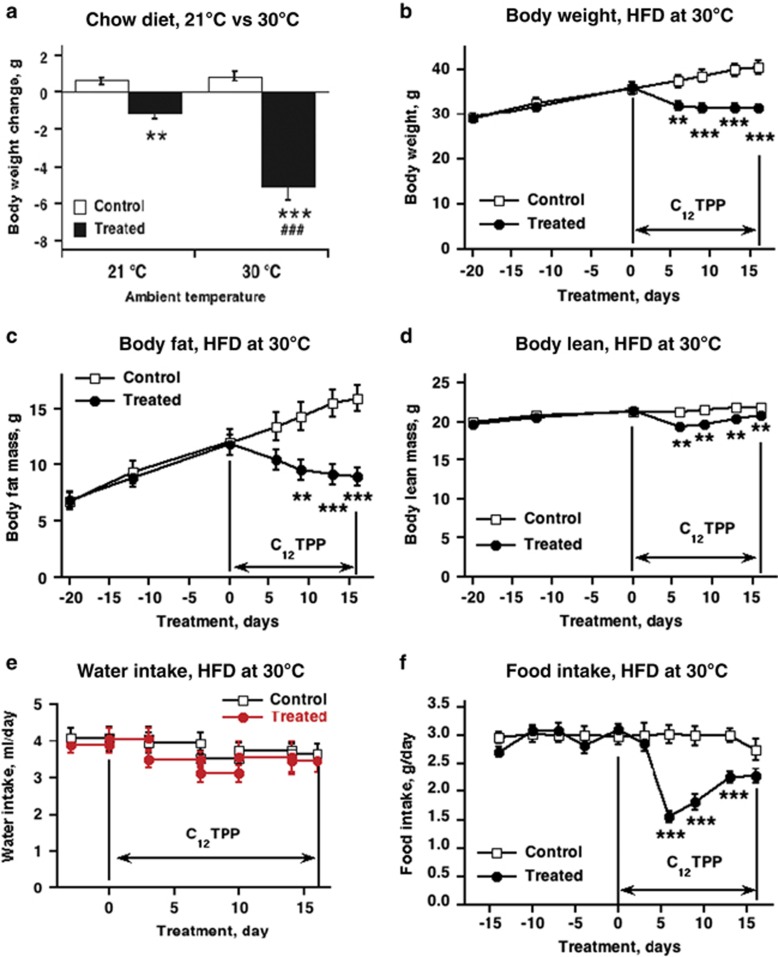
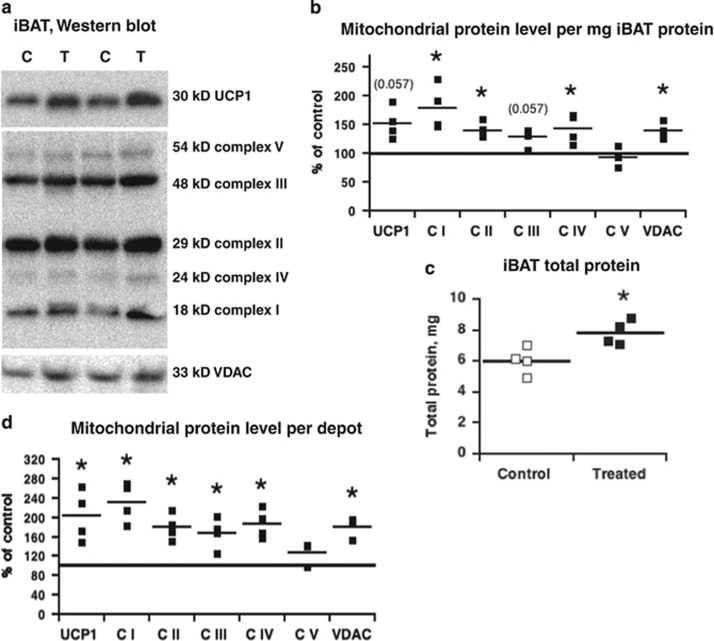
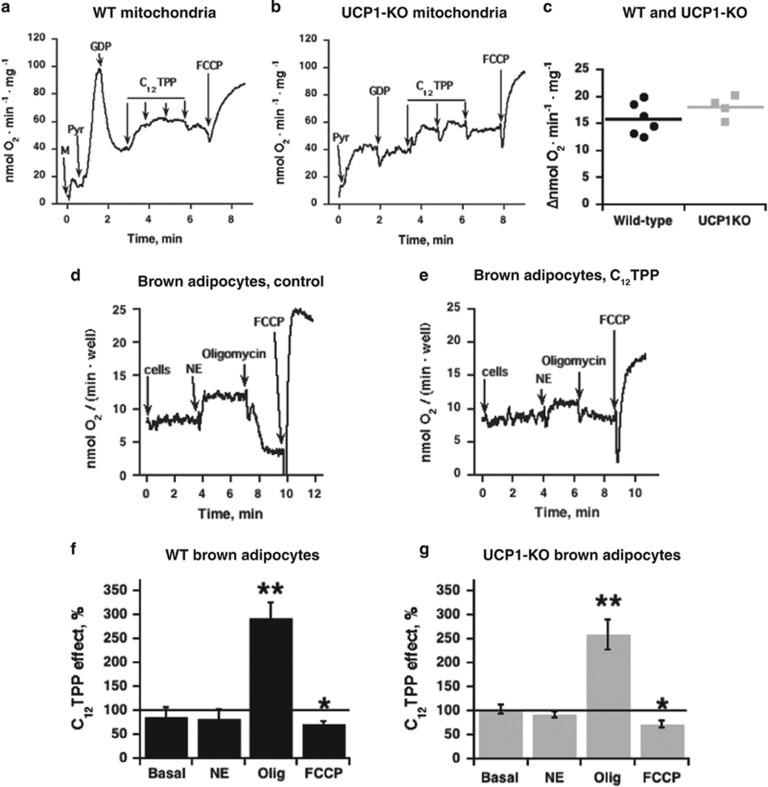
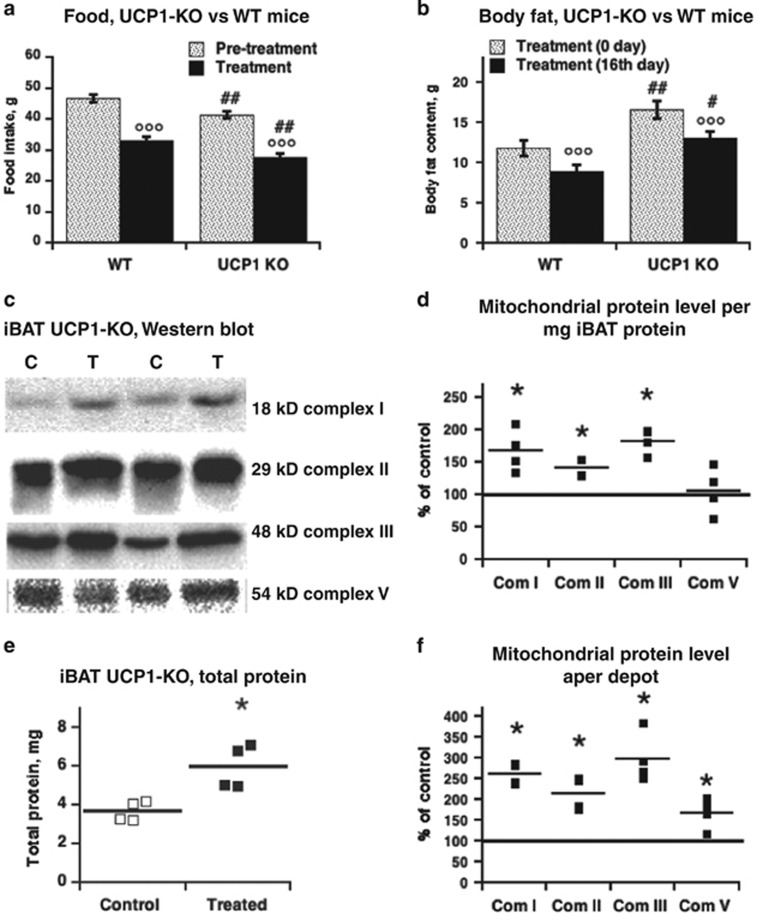
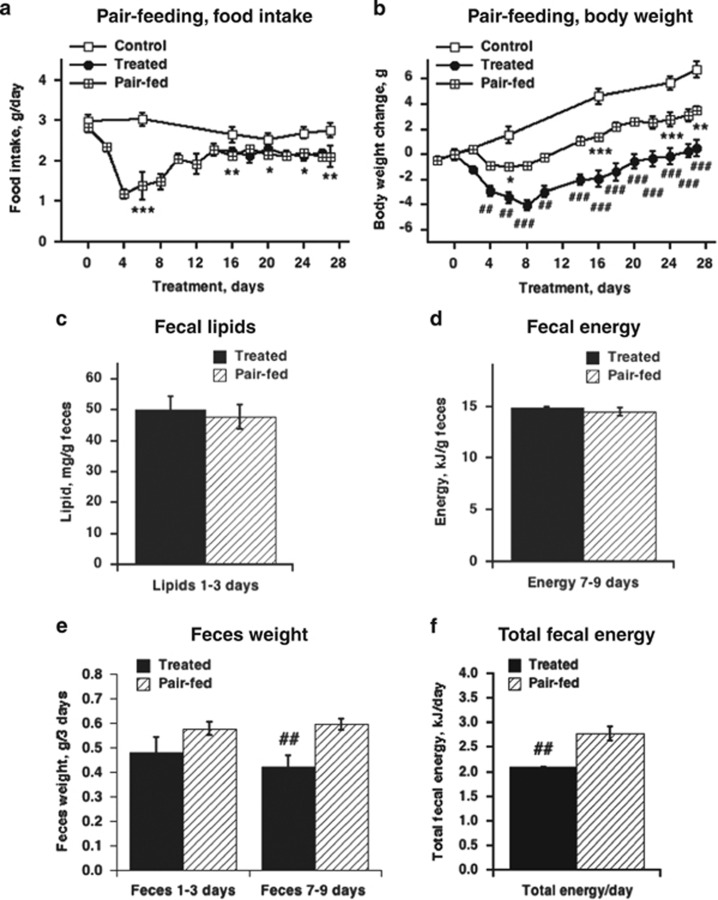
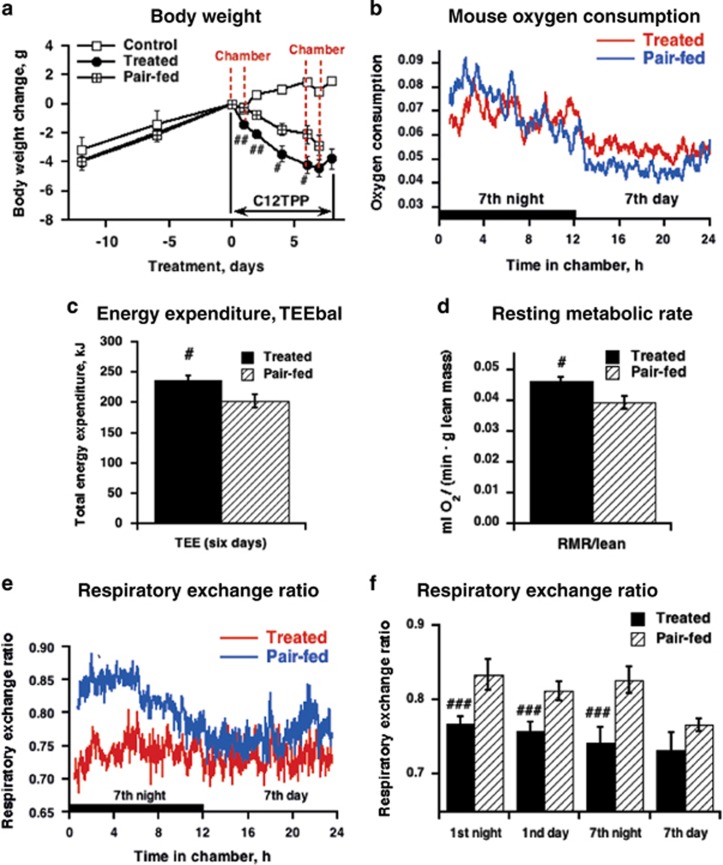
Results: In mice, C12TPP (50 μmol per (day•kg body weight)) in the drinking water significantly reduced body weight (12%, P<0.001) and body fat mass (24%, P<0.001) during the first 7 days of treatment. C12TPP did not affect water palatability and intake or the energy and lipid content in feces. The addition of C12TPP to isolated brown-fat mitochondria resulted in increased oxygen consumption. Three hours of pretreatment with C12TPP also increased oligomycin-insensitive oxygen consumption in brown adipocyte cultures (P<0.01). The effects of C12TPP on mitochondria, cells and mice were independent of uncoupling protein 1 (UCP1). However, C12TPP treatment increased the mitochondrial protein levels in the brown adipose tissue of both wild-type and UCP1-knockout mice. Pair-feeding revealed that one-third of the body weight loss in C12TPP-treated mice was due to reduced food intake. C12TPP treatment elevated the resting metabolic rate (RMR) by up to 18% (P<0.05) compared with pair-fed animals. C12TPP reduced the respiratory exchange ratio, indicating enhanced fatty acid oxidation in mice.

Conclusions: C12TPP combats diet-induced obesity by reducing food intake, increasing the RMR and enhancing fatty acid oxidation.


Figures

Figure 1
Figure 1
Body weight and food intake of wild-type mice treated with C12TPP. (a) Body weight change in mice maintained on a chow diet acclimated at 21 or 30 °C and treated with vehicle (control) or C12TPP (treated). The C12TPP dose was 50 μmol per (day•kg body weight) for 7 days. The values are the means±s.e.m. of five to six mice in each group. Student t-test for unpaired data with unequal variance was used for comparison. *Significant differences between the control and C12TPP-treated groups; #significant difference between 21 and 30 °C. Time course of body weight (b), body fat mass (c), body lean mass (d), water (e) and food intake (f) of mice on a HFD before C12TPP treatment and during 16 days of C12TPP treatment. The period of treatment is indicated by arrows. The values are the means±s.e.m. (n=8 in each group). The statistical analysis of effects was conducted with a repeated measures 2-way analysis of variance (ANOVA): in b, c and f (time: P<0.001; treatment: P<0.001; interaction P<0.001); in d (time: P<0.01; treatment: P<0.001; interaction P<0.05). Asterisks in graphs indicate significant differences between the control and C12TPP-treated groups.
Figure 2
Figure 2
Recruitment of BAT in wild-type mice treated with C12TPP for 16 days on a HFD at thermoneutrality. (a) Western blotting of mitochondrial proteins performed on interscapular BAT (iBAT) protein extract. (b) Mitochondrial protein content per mg tissue protein taken from quantification of western blotting as in a. (c) Total iBAT protein content. (d) Mitochondrial protein content per iBAT depot. In bd, the mean and individual data points of four independent tissue extracts of each group are presented. For graphic presentation on b and d, the mean protein level of control iBAT was defined as 100% and the levels in iBAT from C12TPP-treated mice expressed relatively to this value. For statistics on bd, the raw data were analyzed with Wilcoxon–Mann–Whitney test. Asterisks indicate significant differences between the control and C12TPP-treated groups.
Figure 3
Figure 3
C12TPP-stimulated oxygen consumption in brown-fat mitochondria and brown adipocytes isolated from wild-type and UCP1-KO mice. Representative trace depicting titration with C12TPP of brown-fat mitochondria from wild-type (a) or UCP1-KO (b) mice. C12TPP was successively added at concentrations ranging from 11 to 44 μM (the concentration was increased by 11 μM in each step). Additions were 5 mM pyruvate (Pyr), 1 mM GDP and 2.1 μM carbonyl cyanide p-(trifluoromethoxy) phenylhydrazone (FCCP). (c) Comparison of the effects of C12TPP in wild-type and UCP1-KO brown-fat mitochondria. The mitochondria were examined as shown in a and b, and the values were obtained by estimating the maximal responses. The mean and individual data points of four to six independent mitochondrial preparations for each group are presented. Representative traces depicting the oxygen consumption of control (d) and C12TPP-pretreated (e) brown adipocytes. Primary cultures of brown adipocytes were treated with 0.1% ethanol (control) or 1 μM C12TPP for 3 h before harvesting. Additions were 1 μM β-adrenergic agonist norepinephrine (NE), 2 μM oligomycin and 60 μM FCCP. C12TPP effects on oxygen consumption rates in brown adipocytes originating from wild-type mice (f) or UCP1-ablated mice (g). Control and C12TPP-treated adipocytes were examined in parallel as shown in d and e. The oxygen consumption rate of control adipocytes on a given day was defined as 100% and oxygen consumption rate of C12TPP-treated adipocytes from parallel examination is expressed relative to that of these control adipocytes (as % of basal, NE, oligomycin and FCCP). The bars represent the means±s.e.m. of five independent cell cultures of each genotype. The raw data were analyzed with Student's t-test and asterisks indicate significant differences between control and C12TPP-treated cells.
Figure 4
Figure 4
UCP1-independent effects of C12TPP in mice. (a) Food intake for 16 days of pretreatment and treatment period in the wild-type and UCP1-KO mice on HFD at thermoneutrality. The data for wild-type mice were obtained from Figure 1f. (b) Body fat mass on day 0 (the start of C12TPP treatment) and on the 16th (last) day of treatment in wild-type and UCP1-KO mice. The data for wild-type mice were obtained from Figure 1c. In a and b, the values are means±s.e.m. (n=8 in each group). The data were statistically analyzed with a two-way mixed analysis of variance (ANOVA) with treatment as within-subjects factor and genotype as between-subjects factor: in a, (genotype: P<0.01; treatment: P<0.001; interaction ns); in b, (genotype: P<0.01; day: P<0.001; interaction ns). °Significant differences between days (pretreatment and treatment, or day 0 and day 16); #Significant differences between genotypes. (c) Western blotting of mitochondrial proteins in the total interscapular BAT (iBAT) protein extract from UCP1-KO mice treated with C12TPP for 16 days on a HFD at thermoneutrality. (d) Mitochondrial protein content per mg tissue extract taken from quantification of western blotting as in c. (e) iBAT total protein content. (f) Mitochondrial protein content per total iBAT depot. In df, the mean and individual data points of four independent tissue extracts of each group are presented. For graphic presentation on df, the mean protein level of control iBAT was defined as 100% and the levels in iBAT from C12TPP-treated mice expressed relatively to this value. For statistics on df, the raw data were analyzed with Wilcoxon–Mann–Whitney test. Asterisks indicate significant differences between the control and C12TPP-treated groups.
Figure 5
Figure 5
Food intake-independent effects of C12TPP in wild-type mice on a HFD at thermoneutrality. Time course of food intake (a) and body weight change relative to day 0 (b) of control, C12TPP-treated mice and mice pair-fed with the treated group. Treatment and pair-feeding started on day 0 and finished on day 27. The values are the means±s.e.m. of six to seven mice per group. The effects for overlapping time points with the control were statistically analyzed with a repeated measures two-way analysis of variance (ANOVA): for both a and b (time: P<0.0001; treatment: P<0.0001; interaction P<0.001). The effects for overlapping time points for treated and pair-fed mice was statistically analyzed with a repeated measures two-way ANOVA for a: the food intake in pair-fed group was pre-defined and cannot be included in the ANOVA; for b (time: P<0.0001; treatment: P<0.0001; interaction P<0.001). *Significant differences between the pair-fed and control groups. #Significant differences between the pair-fed and treated groups. The difference between the control and treated groups is not shown. (c and d) Lipid and energy contents of feces. A lipid analysis (c) was performed on feces from the first 3 days of treatment and bomb calorimetry was used to estimate the energy (d) content of feces from 7 to 9 days of treatment. Bars represent the mean±s.e.m. of four to six mice per group. (e) Amount of feces produced during the first three days (1 to 3) and 7 to 9 days of treatment. Bars represent the mean±s.e.m. of five to six mice per group. The data were statistically analyzed with a repeated measures two-way ANOVA: (treatment: P<0.001; days ns; interaction ns). #Significant differences between the pair-fed and treated groups. (f) Total fecal energy per day of C12TPP treatment. The fecal energy (as in d) was multiplied by the amount of feces (as in e) and this amount was divided by 3 days. Bars represent the mean±s.e.m. of five to six mice per group. The data were analyzed with Student's t-test and # indicates significant differences between the pair-fed and treated groups.
Figure 6
Figure 6
Effects of C12TPP on the rates of oxygen consumption and RER in wild-type mice on a HFD at thermoneutrality. (a) Change in body weight over time relative to day 0 in control, C12TPP-treated and pair-fed to treated mice. Treatment started on day 0 and finished on day 7, as is indicated by arrows. The mice were exposed twice to indirect calorimetry measurements on day 1 and 7 of treatment. The periods inside the chamber are indicated by red lines. The values are the means±s.e.m. of five to six mice per group. The effects were statistically analyzed using a repeated measures two-way analysis of variance (ANOVA) (time: P<0.01; treatment: P<0.01; interaction P<0.01). #Significant differences between the treated and pair-fed groups. Significant differences from the control are not shown. (b) Rate of oxygen consumption (ml O2 per min·g lean body mass) of treated and pair-fed mice on the seventh day of treatment. Nighttime is indicated by the black box on the x axis. The values are the means of six mice per group. (c) TEE (TEEbal) estimated using the energy balance method for the 6 days of treatment. (d) RMR in C12TPP-treated and pair-fed mice during the seventh light phase of day of treatment. In c and d, the values are the means±s.e.m. (n=6 for each group). The data were analyzed with a paired Student's t-test and the # indicates significant differences between the pair-fed and treated groups. (e) RER traces during the seventh day of treatment. Each trace is the mean of n=6 mice per group. (f) Average RER of treated and pair-fed mice. The values are the means±s.e.m. (n=5–6 for each group). The effects were statistically analyzed with a two-way ANOVA matched for both time and mouse (separate for day 1 and day 7 due to not being the same animals): day 1 (time: P<0.05; treatment: P<0.05; interaction P<0.05); day 7 (time: P<0.05; treatment: P<0.05; interaction P<0.01). #Significant differences between the treated and pair-fed groups.

Similar articles

Cited by

References

    1. Rodgers RJ, Tschop MH, Wilding JP. Anti-obesity drugs: past, present and future. Dis Models Mech 2012; 5: 621–626. - PMC - PubMed
    1. Skulachev VP. Uncoupling: new approaches to an old problem of bioenergetics. Biochim Biophys Acta 1998; 1363: 100–124. - PubMed
    1. Brand MD. The contribution of the leak of protons across the mitochondrial inner membrane to standard metabolic rate. J Theor Biol 1990; 145: 267–286. - PubMed
    1. Nedergaard J, Golozoubova V, Matthias A, Asadi A, Jacobsson A, Cannon B. UCP1: the only protein able to mediate adaptive non-shivering thermogenesis and metabolic inefficiency. Biochim Biophys Acta 2001; 1504: 82–106. - PubMed
    1. Tainter ML, Cutting WC, Stockton AB. Use of dinitrophenol in nutritional disorders: a critical survey of clinical results. Am J Public Health Nations Health 1934; 24: 1045–1053. - PMC - PubMed

Publication types

MeSH terms