

Contrast-enhanced ultrasonography of the hepatic vein in normal dogs
- PMID: 27534912
- PMCID: PMC5240750
- DOI: 10.1292/jvms.16-0062
Contrast-enhanced ultrasonography of the hepatic vein in normal dogs
Abstract
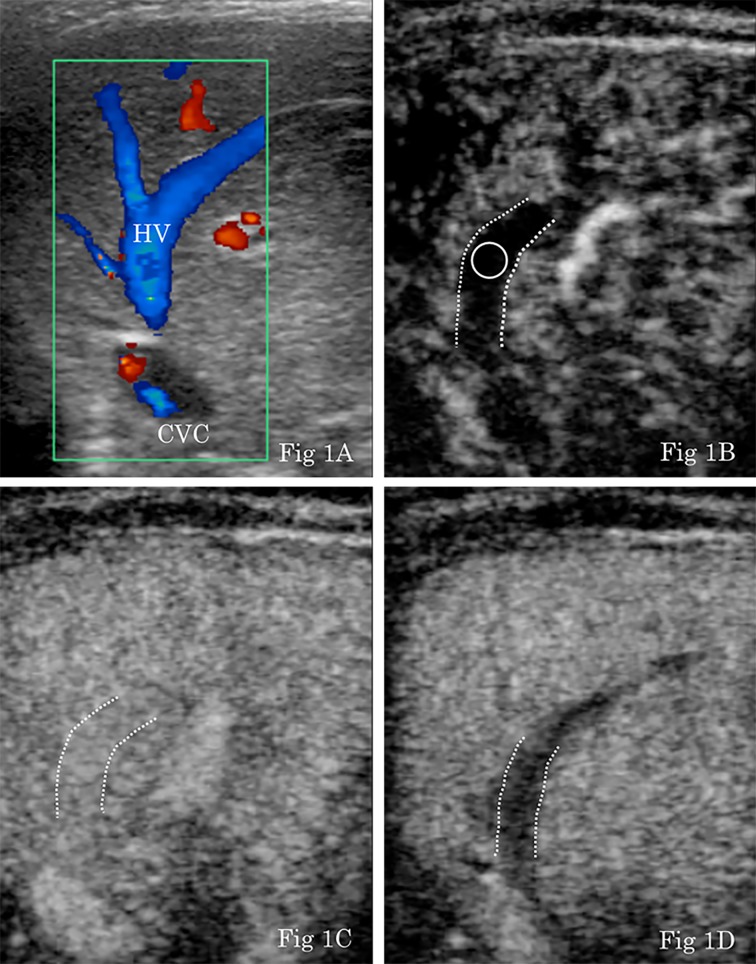
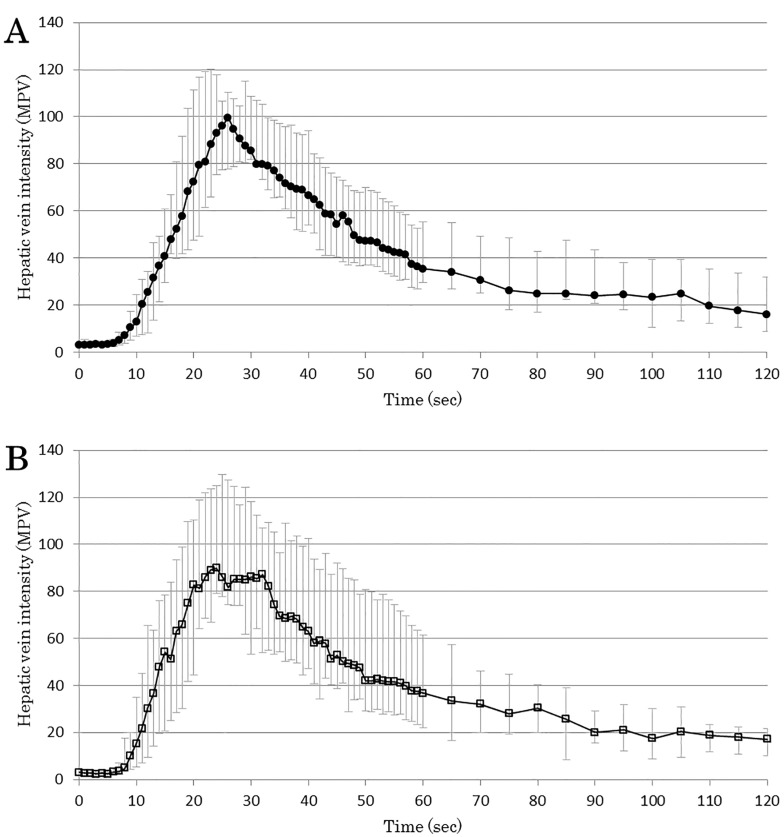
Contrast-enhanced ultrasonography (CEUS) of the hepatic vein can assess intrahepatic hemodynamic changes and has been studied as a noninvasive method to assess the severity of portal hypertension and hepatic fibrosis in humans. However, few reports have described its usefulness in veterinary medicine. The purpose of this study was to characterize CEUS findings of the hepatic vein in normal dogs and assess the repeatability of this method both in a conscious group (n=6) and a sedated group (n=6). Sonazoid® (0.01 ml/kg) was used as a contrast agent, and scanning of the hepatic vein was performed for 2 min. Time-intensity curves were generated from regions of interest in the hepatic vein. Four perfusion parameters were measured for quantitative analysis: hepatic vein arrival time (HVAT), time to peak (TTP), time to peak phase (TTPP) and wash-out ratio (WR). CEUS examinations were performed three times in each dog. The median (range) values of HVAT, TTP, TTPP and WR in the conscious group were 13.5 sec (9-22 sec), 12.5 sec (6-24 sec), 8 sec (6-13 sec) and 78.0% (60.7-91.7%), respectively. Median (range) values of HVAT, TTP, TTPP and WR in the sedated group were 12 sec (8-17 sec), 12.5 sec (9-17 sec), 9 sec (7-13 sec) and 84.1% (63.0-94.4%), respectively. The coefficients of variation of these parameters in the conscious and sedated groups were 7.6-29.7% and 11.8-14.8%, respectively.
Figures

Similar articles
-
Repeatability and reproducibility of quantitative contrast-enhanced ultrasonography for assessing duodenal perfusion in healthy dogs.J Vet Med Sci. 2017 Sep 29;79(9):1585-1590. doi: 10.1292/jvms.17-0174. Epub 2017 Aug 5. J Vet Med Sci. 2017. PMID: 28781327 Free PMC article.
-
Assessment of contrast-enhanced ultrasonography of the hepatic vein for detection of hemodynamic changes associated with experimentally induced portal hypertension in dogs.Am J Vet Res. 2017 Apr;78(4):465-471. doi: 10.2460/ajvr.78.4.465. Am J Vet Res. 2017. PMID: 28346001
-
Contrast-enhanced ultrasonography using Sonazoid to evaluate changes in hepatic hemodynamics in acute liver injury.J Gastroenterol Hepatol. 2011 Dec;26(12):1749-56. doi: 10.1111/j.1440-1746.2011.06790.x. J Gastroenterol Hepatol. 2011. PMID: 21615794
-
Qualitative and quantitative contrast enhanced ultrasonography of the pancreas using bolus injection and continuous infusion methods in normal dogs.J Vet Med Sci. 2013 Dec 30;75(12):1601-7. doi: 10.1292/jvms.13-0199. Epub 2013 Aug 13. J Vet Med Sci. 2013. PMID: 23955397 Free PMC article.
-
Hepatic vein arrival time as assessed by contrast-enhanced ultrasonography is useful for the assessment of portal hypertension in compensated cirrhosis.Hepatology. 2012 Sep;56(3):1053-62. doi: 10.1002/hep.25752. Epub 2012 Jul 12. Hepatology. 2012. PMID: 22473911
Cited by
-
Washout Ratio in the Hepatic Vein Measured by Contrast-Enhanced Ultrasonography to Distinguish Between Inflammatory and Noninflammatory Hepatic Disorders in Dogs.J Vet Intern Med. 2017 May;31(3):770-777. doi: 10.1111/jvim.14685. Epub 2017 Apr 5. J Vet Intern Med. 2017. PMID: 28382699 Free PMC article.
-
Repeatability and reproducibility of quantitative contrast-enhanced ultrasonography for assessing duodenal perfusion in healthy dogs.J Vet Med Sci. 2017 Sep 29;79(9):1585-1590. doi: 10.1292/jvms.17-0174. Epub 2017 Aug 5. J Vet Med Sci. 2017. PMID: 28781327 Free PMC article.
-
Two-dimensional shear wave elastography of liver in healthy dogs: anaesthesia as a source of variability.Int J Vet Sci Med. 2022 May 23;10(1):46-51. doi: 10.1080/23144599.2022.2073138. eCollection 2022. Int J Vet Sci Med. 2022. PMID: 35677323 Free PMC article.
References
-
- Albrecht T., Blomley M. J., Cosgrove D. O., Taylor-Robinson S. D., Jayaram V., Eckersley R., Urbank A., Butler-Barnes J., Patel N.1999. Non-invasive diagnosis of hepatic cirrhosis by transit-time analysis of an ultrasound contrast agent. Lancet 353: 1579–1583. doi: 10.1016/S0140-6736(98)06373-9 - DOI - PubMed
-
- Blomley M. J., Lim A. K., Harvey C. J., Patel N., Eckersley R. J., Basilico R., Heckemann R., Urbank A., Cosgrove D. O., Taylor-Robinson S. D.2003. Liver microbubble transit time compared with histology and Child-Pugh score in diffuse liver disease: a cross sectional study. Gut 52: 1188–1193. doi: 10.1136/gut.52.8.1188 - DOI - PMC - PubMed
MeSH terms
Substances
LinkOut - more resources
Full Text Sources
Other Literature Sources
Medical