. 2016 Oct;6(10):1166-1181.
doi: 10.1158/2159-8290.CD-16-0237. Epub 2016 Aug 17.

Targeting Chromatin Regulators Inhibits Leukemogenic Gene Expression in NPM1 Mutant Leukemia

Affiliations

Targeting Chromatin Regulators Inhibits Leukemogenic Gene Expression in NPM1 Mutant Leukemia

Michael W M Kühn et al. Cancer Discov. 2016 Oct.

Abstract

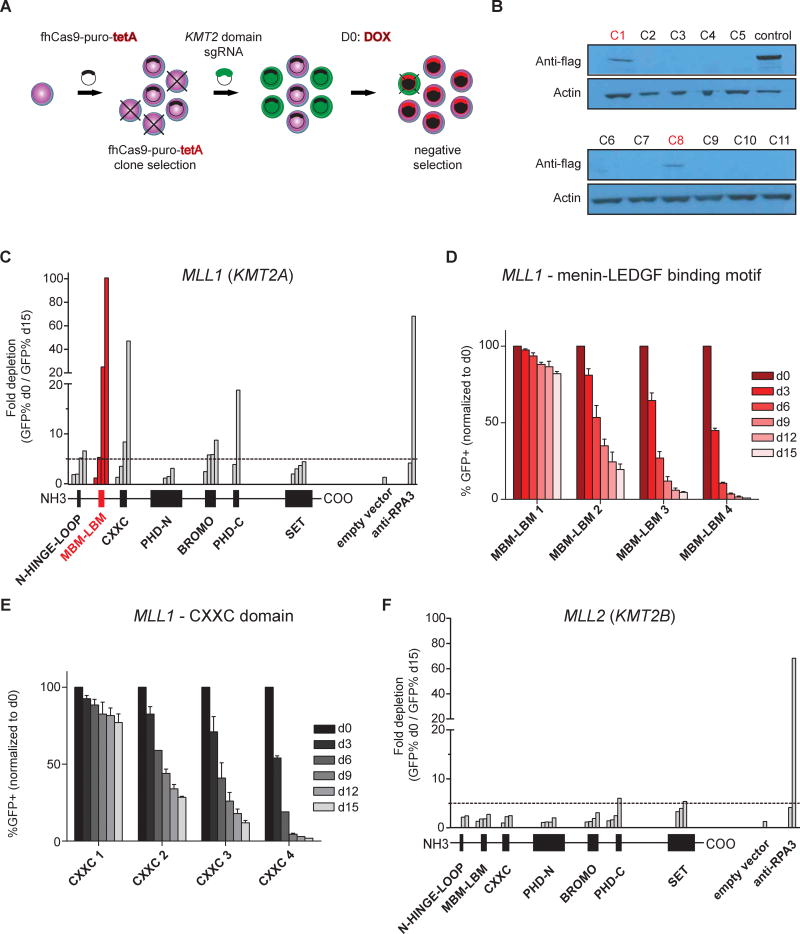
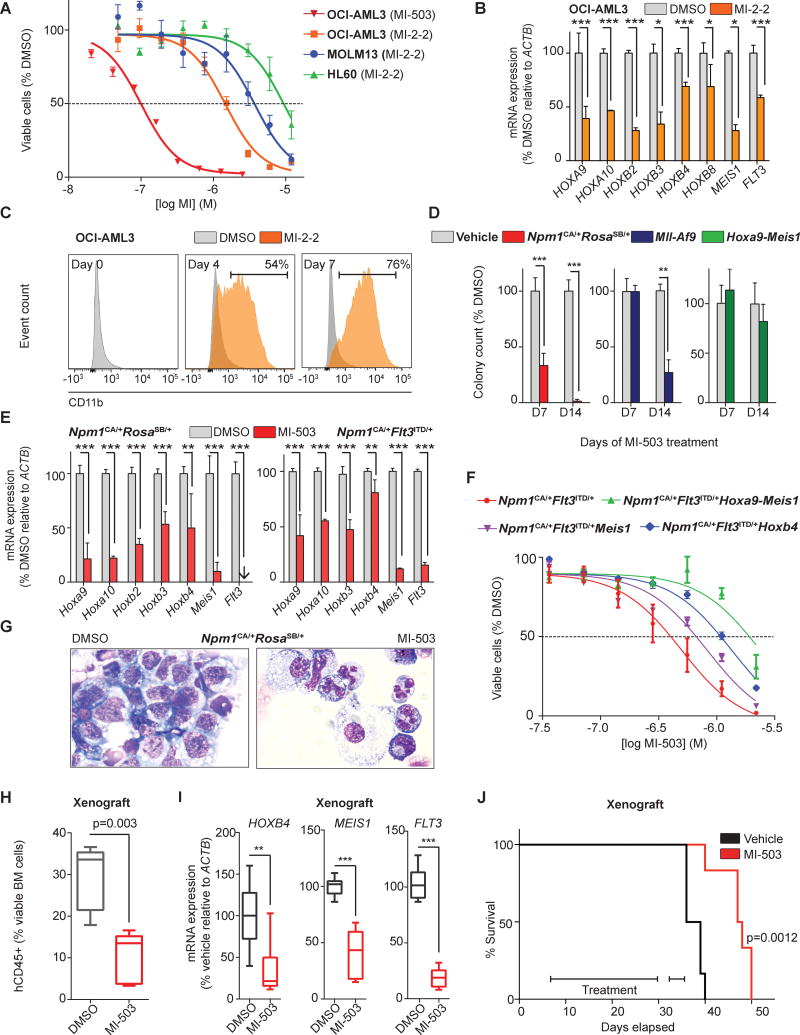
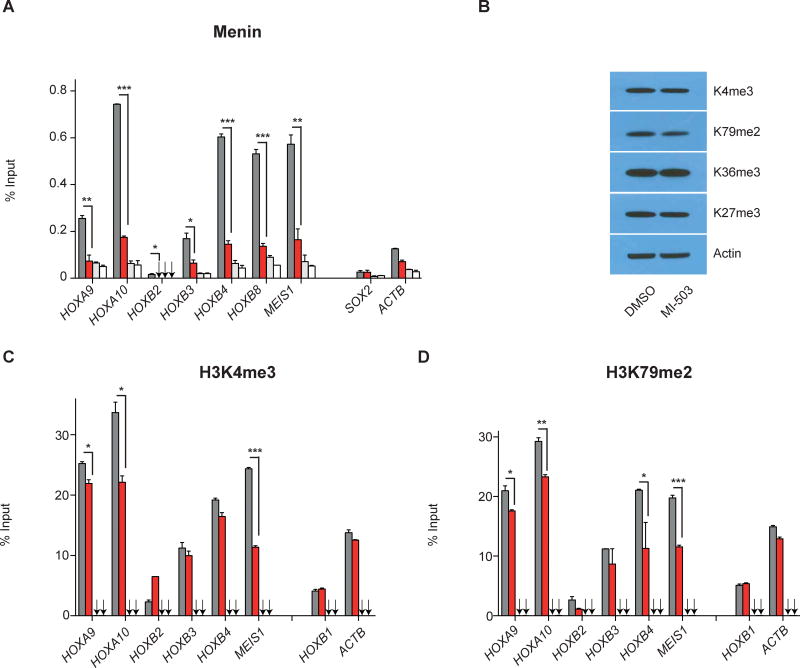
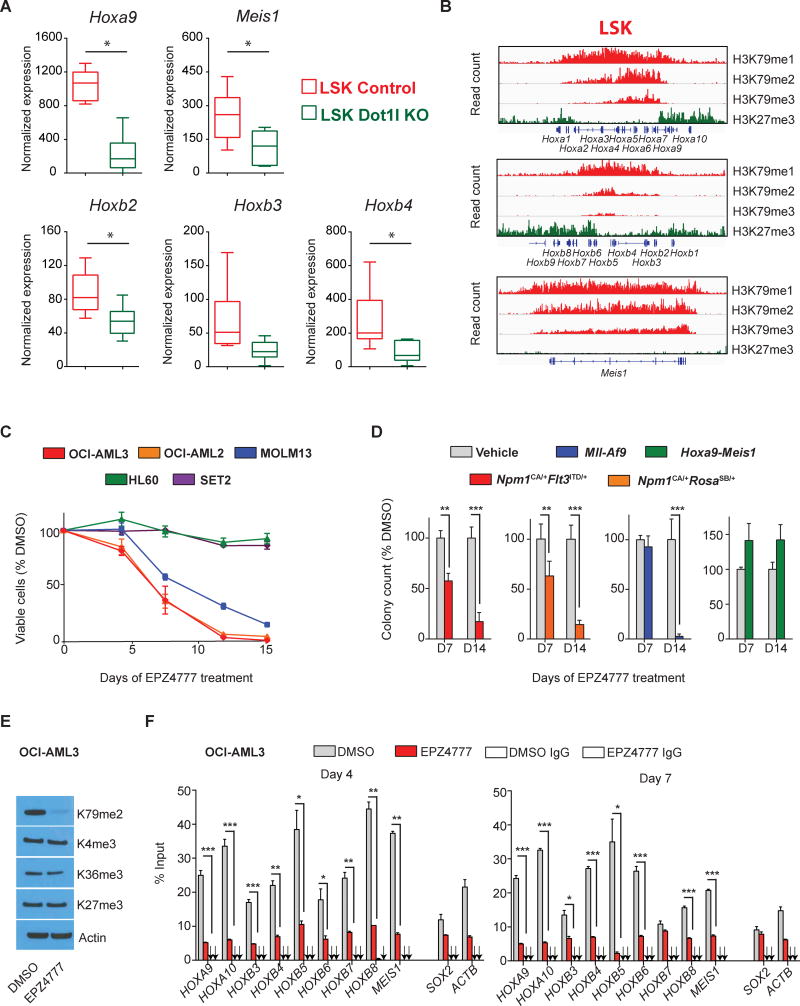
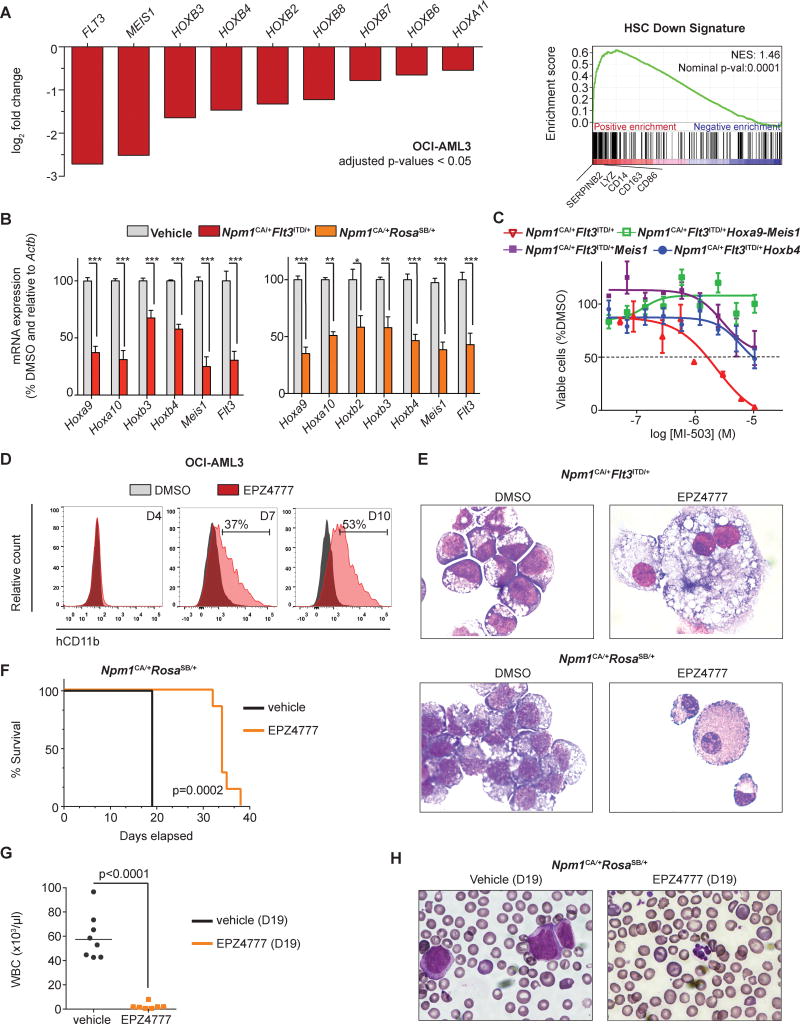
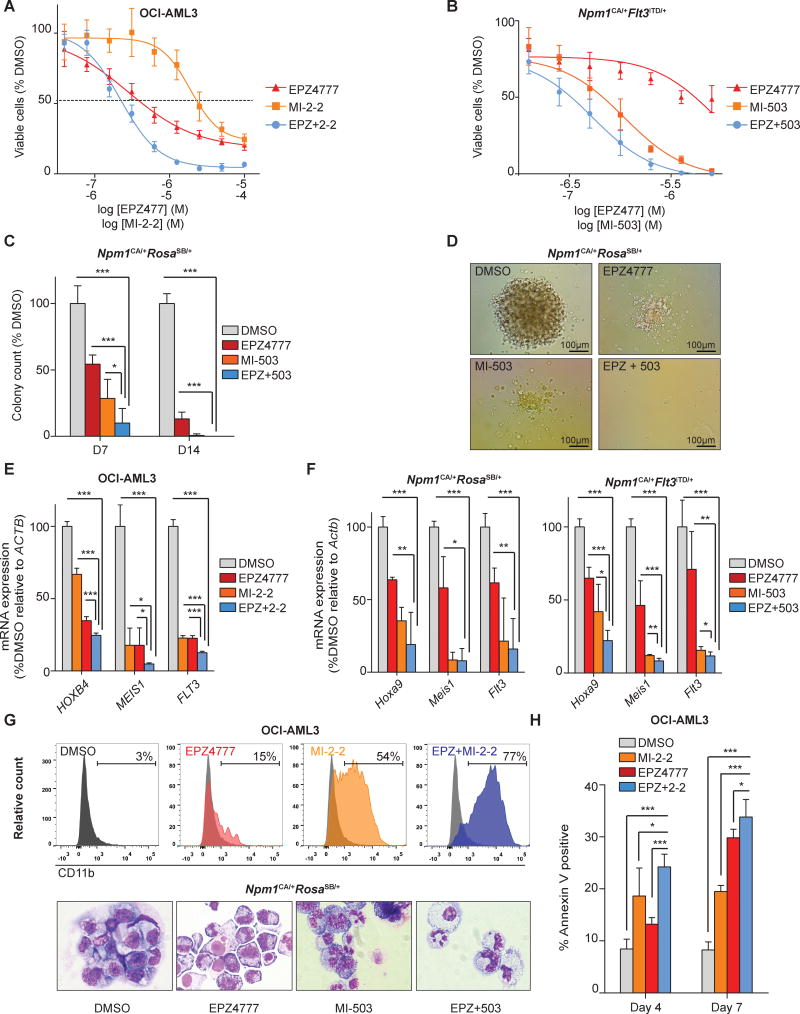
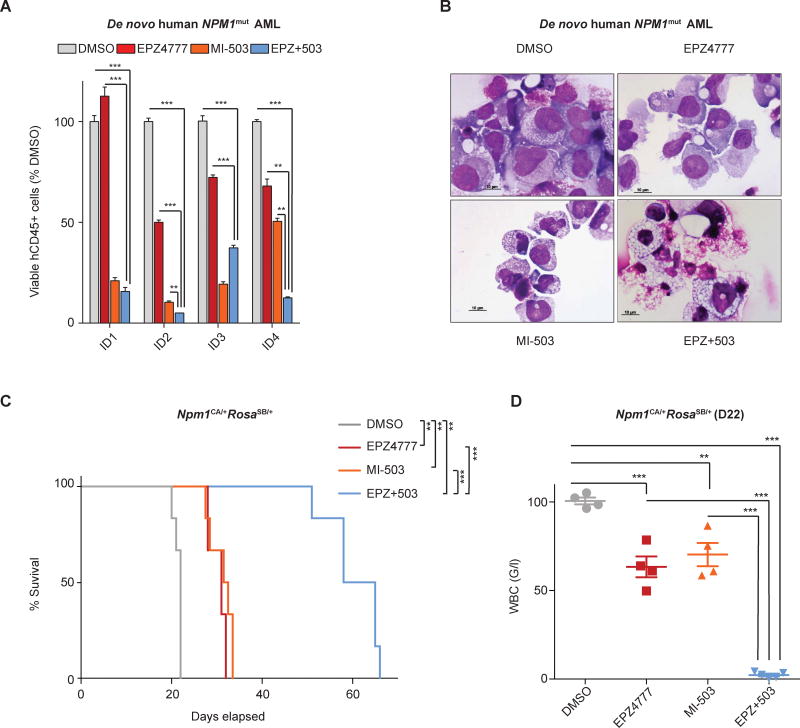
Homeobox (HOX) proteins and the receptor tyrosine kinase FLT3 are frequently highly expressed and mutated in acute myeloid leukemia (AML). Aberrant HOX expression is found in nearly all AMLs that harbor a mutation in the Nucleophosmin (NPM1) gene, and FLT3 is concomitantly mutated in approximately 60% of these cases. Little is known about how mutant NPM1 (NPM1mut) cells maintain aberrant gene expression. Here, we demonstrate that the histone modifiers MLL1 and DOT1L control HOX and FLT3 expression and differentiation in NPM1mut AML. Using a CRISPR/Cas9 genome editing domain screen, we show NPM1mut AML to be exceptionally dependent on the menin binding site in MLL1. Pharmacologic small-molecule inhibition of the menin-MLL1 protein interaction had profound antileukemic activity in human and murine models of NPM1mut AML. Combined pharmacologic inhibition of menin-MLL1 and DOT1L resulted in dramatic suppression of HOX and FLT3 expression, induction of differentiation, and superior activity against NPM1mut leukemia.

Significance: MLL1 and DOT1L are chromatin regulators that control HOX, MEIS1, and FLT3 expression and are therapeutic targets in NPM1mut AML. Combinatorial small-molecule inhibition has synergistic on-target activity and constitutes a novel therapeutic concept for this common AML subtype. Cancer Discov; 6(10); 1166-81. ©2016 AACR.See related commentary by Hourigan and Aplan, p. 1087This article is highlighted in the In This Issue feature, p. 1069.


Figures

Figure 1
Figure 1. CRISPR-Cas9 mutagenesis of exons targeting MLL protein domains in NPM1mut AML cells
(A) Experimental strategy for CRISPR-Cas9 negative selection screening: Engineering a clonal NPM1mut OCI-AML3 cell line that expresses a flag-tagged human codon-optimized Cas9 (fhCas9) vector containing a puro resistance gene (puro) and tetracycline-inducible transcriptional activator (tetA). GFP reporters of sgRNA constructs were used to track sgRNA negative selection after doxycycline induction of Cas9 (D0, day 0; DOX, doxycycline). (B) Immunoblotting for flag-tagged hCas9 after doxycycline treatment in eleven OCI-AML3-Cas9 single cell clones. C1 and C8 clones were selected for two independent screens of MLL1 and MLL2. (C and F) Summary of negative selection experiments with sgRNAs targeting exons encoding specific MLL1 and MLL2 protein domains. Negative selection is plotted as the fold depletion of GFP+ cells (d0 GFP% divided by d15 GFP%) during 18 days in culture. Each bar represents an independent sgRNA. The location of each sgRNA relative to the MLL1 or MLL2 protein is indicated along the x axis. The dashed line indicates a fivefold change. The data shown are the mean value of two independent replicates. Empty vector and anti-RPA3 sgRNA represent negative and positive controls. (D and E) Negative selection competition assay that plots the percentage of GFP+ cells over time following transduction of OCI-AML3-Cas9 with the indicated sgRNAs. GFP+ percentage is normalized to the day 0 measurement following doxycycline induction of Cas9 (3 days after sgRNA transduction). N-HINGE-LOOP, N-terminal hinge loop of the menin-LEDGF binding motif lacking many specific interactions; MBM-LBM, N-terminal fragment of MLL1 containing the menin and the LEDGF binding motif (as defined by Huang et al(35)); CXXC, CXXC-type zink finger domain; PHD-N, N-terminal plant homeodomains; BROMO, bromodomain; PHD-C , C-terminal plant homeodomain; SET, SET-domain. Data shown in panel C-F represent mean of biological duplicates.
Figure 2
Figure 2. Effects of menin-MLL11-i in human and murine NPM1mut leukemia cells in vitro and in vivo
(A) Dose response curves from cell viability assays after 11 days of MI-2-2 or MI-503 treatment (B) HOX gene expression in the human OCI-AML3 cells following 4 days of MI-2-2 [12μM] treatment. (C) Cell differentiation upon menin-MLL1-i (MI-2-2: [12μM]) as determined by CD11b expression in OCI-AML3 cells (at day 0, 4, and 7 of treatment). (D) MI-503 [2.5μM] treatment of murine Npm1CA/+RosaSB/+, Mll-Af9, and Hoxa9-Meis1-transformed cells in colony-forming assays assessed on day 7 and day 14 of treatment. (E) Gene expression in murine Npm1CA/+Flt3ITD/+ and Npm1CA/+RosaSB/+ cells assessed on day 4 of MI-503 treatment [2.5μM]. (F) Dose response curves from cell viability assays after 11 days of MI-503 treatment comparing Npm1CA/+Flt3ITD/+ cells versus Npm1CA/+Flt3ITD/+ cells overexpressing Hoxb4, Meis1, or Hoxa9-Meis1. (G) Morphological changes consistent with granulocytic monocytic differentiation in murine Npm1CA/+RosaSB/+ cells after 7 days of MI-503 [2.5μM] treatment. (H) Assessment of leukemia burden in an OCI-AML3 xenotransplantation model after 7-12 days of MI-503 in vivo treatment as determined by human CD45 positive cells in the murine bone marrow. (I) Gene expression changes after 12 days of MI-503 [50mg/kg bid IP] in vivo treatment. (J) Survival of OCI-AML3 xenograft mice (n=6 mice/group) treated with MI-503 [50mg/kg bid IP]. Data represent averages of two independent experiments, each performed in three replicates (A, B, C, D, E, F) except for the dose response to MI-503 (red curve in A) that was once performed (in three replicates) to independently confirm sensitivity to menin-MLL1-i. Error bars represent standard error of the mean (SEM). The whiskers of box plots (H, I) represent minimal and maximal values of 5 (H) and 3 (I) mice per group, the box represents the SEM, the line represents the median.
Figure 3
Figure 3. Menin-MLL1-i depletes menin, H3K4me3, and H3K79me2 at HOX and MEIS1 gene loci in OCI-AML3 cells
(A) Relative enrichment of menin at selected HOXA, HOXB, and MEIS1 gene loci in OCI-AML3 cells upon 5 days of MI-503 [2.5μM] treatment compared to drug vehicle as assessed by ChIP-PCR. (B) Immunoblotting of indicated histone marks following 4 days of MI-503 treatment [2.5μM]. (C+D) H3K4me3 and H3K79me2 enrichment across the HOX gene locus and at MEIS1 following 6 days of MI-503 treatment [2.5μM] versus DMSO. One representative experiment is shown, bar graphs represent averages of three replicates, arrows point to IgG control values, error bars represent SEM. Results were confirmed in two additional independent experiments.
Figure 4
Figure 4. DOT1L is required for HOXB-cluster expression in early hematopoietic progenitors and a therapeutic target in NPM1mut leukemia
(A) Expression of Hoxa9, Meis1, Hoxb2, Hoxb3, and Hoxb4 in LSK cells sorted from Dot1lfl/fl or Dot1lWT/WT mice crossed with Mx1-Cre mice after 10 days of pIpC treatment. (B) Representative profiles for ChIP-seq using anti-H3K79me1, H3K79me2, H3K79me3, and H3K27me3 antibodies in LSK cells at the Hoxa- and Hoxb-cluster. The y axis scale represents read density per million sequenced reads. (C) Growth of OCI-AML3, MOLM13, SET2, OCI-AML2, and HL60 cells exposed to EPZ4777 [10μM]. Viable cells were counted and replated at equal cell numbers in fresh media with fresh compound every 3-4 days. Results were plotted as percentage of split-adjusted viable cells in the presence of EPZ4777 [10μM] and normalized to DMSO control. (D) Colony numbers of Npm1CA/+Flt3ITD/+, Npm1CA/+RosaSB/+, Mll-Af9, and Hoxa9-Meis1 cells exposed to 10μM EPZ4777 and compared to DMSO vehicle control. Data were obtained at day 7 (D7), when viable cells were harvested and replated in fresh methylcellulose with fresh compound and at day 14 (D14) of treatment. (E) Immunoblotting of global histone marks in OCI-AML3 cells upon 4 days of EPZ4777 treatment [10μM]. (F) H3K79me2 levels across the HOXA- and HOXB-cluster locus and MEIS1 in OCI-AML3 cells after 4 and 7 days of EPZ4777 [10μM] treatment and compared to DMSO control as assessed by ChIP-PCR. The box plots in (A) shows normalized expression values of 6 mice per group. Whiskers represent minimal and maximal values, the box represents the standard error of the mean, the line represents the median. Data in (C) and (D) represent averages of three independent experiments, each performed in three replicates. Error bars represent the SEM. For ChIP data in F, one representative experiment performed in three replicates is shown, arrows point to the IgG control values, error bars represent the SEM. Results were confirmed in two additional independent experiments.
Figure 5
Figure 5. Effects of DOT1L-i on gene expression, cell differentiation, and leukemia initiating potential in NPM1mut AML cells
(A) (Left panel) Log2 fold change of HOX genes, MEIS1, and FLT3 between OCI-AML3 cells treated for 7 days with 10μM EPZ4777 or DMSO vehicle control as assessed by RNA-sequencing. Only expressed HOXA- and HOXB-cluster genes are shown with a normalized read count of ≥100 reads within the vehicle control, ≥0.5 log2 fold change, and a p-value (adjusted for multiple testing) of < 0.05. (Right panel) GSEA of RNA-sequencing data showing enrichment of genes upregulated with EPZ4777 treatment for genes silenced in normal hematopoietic cord blood stem cells. (B) Gene expression in murine Npm1CA/+Flt3ITD/+ and Npm1CA/+RosaSB/+ cells assessed on day 7 of EPZ4777 treatment [10μM] by quantitative PCR. (C) Dose response curves from cell viability assays after 14 days of EPZ4777 treatment comparing Npm1CA/+Flt3ITD/+ cells versus Npm1CA/+Flt3ITD/+ cells overexpressing Hoxb4, Meis1, or Hoxa9-Meis1. (D) Cell differentiation upon DOT1L-i (EPZ4777 [10μM]) as determined by flow cytometry for CD11b expression in OCI-AML3 cells (at day 0, 4, and 7 of treatment). (E) Morphological changes in Npm1CA/+Flt3ITD/+ (upper panel) and Npm1CA/+RosaSB/+ (lower panel) cells consistent with monocytic differentiation in murine cells after 14 days of EPZ4777 [10μM] treatment. (F) Kaplan-Meier survival curve of mice transplanted with pretreated Npm1CA/+RosaSB/+ leukemia cells (vehicle: n= 8 mice/group; EPZ4777: n=7 mice/group). (G) White blood cell count and (H) morphology of mice transplanted with pretreated Npm1CA/+RosaSB/+ leukemia cells on day 19 post transplantation. Data in (A) represent averages of three independently treated replicates per group, data in (B), (C), and (D) represent averages of three independent experiments, each performed in three replicates. Error bars represent the SEM.
Figure 6
Figure 6. Effects of combinatorial menin-MLL11-i and DOT1L-i in murine and NPM1mut leukemia cells
(A) Dose response curves from cell viability assays of OCI-AML3 cells comparing 7 days of MI-2-2 [12μM], EPZ4777 [10μM], and combinatorial EPZ4777 [10μM] and MI-2-2 [12μM] (EPZ+2-2) treatment. (B) Dose response curves from cell viability assays of Npm1CA/+Flt3ITD/+ leukemia cells comparing 11 days of MI-503 [2.5μM], EPZ4777 [10μM], or combinatorial EPZ4777 [10μM] and MI-503 [2.5μM] (EPZ + 503) treatment. (C) Comparison of MI-503 [2.5μM], EPZ4777 [10μM], and combinatorial MI-503 [2.5μM] and EPZ4777 [10μM] treatment of murine Npm1CA/+RosaSB/+ leukemia cells in colony-forming assays assessed on day 7 (D7) and day 14 (D14) of treatment. (D) Representative colony formation of Npm1CA/+RosaSB/+ leukemia cells following 7 days of EPZ4777 [10μM], MI-503 [2.5μM] or combinatorial EPZ4777 and MI-503 treatment. (E) Gene expression changes of selected leukemogenic genes in human OCI-AML3 following 4 days of EPZ4777 [10μM], MI-2-2 [12μM] or combinatorial EPZ4777 and MI-2-2 treatment as assessed by quantitative PCR. (F) Expression changes of Hoxa9, Meis1, and Flt3 in murine Npm1CA/+RosaSB/+ (left panel) and Npm1CA/+Flt3ITD/+ leukemia cells (right panel) following 4 days of EPZ4777 (10μM), MI-503 (2.5μM) or combinatorial EPZ4777 and MI-503 treatment as assessed by quantitative PCR. (G) Cell differentiation of NPM1mut leukemia cells as assessed by flow cytometric analysis of CD11b in OCI-AML3 cells (upper panel) and cytology of Npm1CA/+ RosaSB/+ leukemia cells (lower panel). Representative pictures are shown in the lower panel and data were obtained after 4 days of treatment (EPZ4777: [10μM], MI-2-2: [12μM], MI-503: [2.5μM]). (H) Apoptosis in OCI-AML3 cells following 4 days of EPZ4777 [10μM], MI-2-2 [12μM] or combinatorial EPZ4777 [10μM] and MI-2-2 [12μM] treatment as assessed by flow-cytometric staining for Annexin V. Data represent averages of two independent experiments, each performed in three replicates (A, B, C, E, F, G, H). Error bars represent the SEM.
Figure 7
Figure 7. Effects of single and combinatorial menin-MLL11-i and DOT1L-i on primary NPM1mut AML patient samples and on leukemia initiating potential of murine NPM1mut leukemias
(A) Viable cell numbers of four independent samples of de novo NPM1mut AML treated in co-culture assays with DMSO, EPZ4777 [10μM], MI-503 [2.5μM], or combinatorial EPZ4777 [10μM] and MI-503 [2.5μM]. (B) Representative pictures of cytospins from de novo NPM1mut AML blasts after 10 days of in vitro treatment with vehicle or EPZ4777 [10μM], MI-503 [2.5μM], or combinatorial EPZ4777+MI-503 [10μM+2.5μM] treatment. (C) Kaplan-Meier survival curve of mice transplanted with pretreated Npm1CA/+RosaSB/+ leukemia cells comparing drug vehicle, EPZ4777, MI-503, or combinatorial EPZ4777 and MI-503 inhibition (n=6 mice/group). (D) Engraftment values in the peripheral blood 22 days after transplantation of pretreated Npm1CA/+RosaSB/+ leukemia cells comparing drug vehicle, EPZ4777, MI-2-2, and combinatorial EPZ4777 and MI-503 inhibition (n=4 mice/group). Bar graphs in (A) represent averages of three replicates assessing one of four independent AML patient samples. Each of the four samples was assessed independently. Error bars represent the SEM.

Comment in

Similar articles

Cited by

References

    1. Sauvageau G, Lansdorp PM, Eaves CJ, Hogge DE, Dragowska WH, Reid DS, et al. Differential expression of homeobox genes in functionally distinct CD34+ subpopulations of human bone marrow cells. Proc Natl Acad Sci U S A. 1994 Dec 6;91(25):12223–7. - PMC - PubMed
    1. Giampaolo A, Sterpetti P, Bulgarini D, Samoggia P, Pelosi E, Valtieri M, et al. Key functional role and lineage-specific expression of selected HOXB genes in purified hematopoietic progenitor differentiation. Blood. 1994 Dec 1;84(11):3637–47. - PubMed
    1. Alharbi RA, Pettengell R, Pandha HS, Morgan R. The role of HOX genes in normal hematopoiesis and acute leukemia. Leukemia. 2013 Apr;27(5):1000–8. - PubMed
    1. Spencer DH, Young MA, Lamprecht TL, Helton NM, Fulton R, O'Laughlin M, et al. Epigenomic analysis of the HOX gene loci reveals mechanisms that may control canonical expression patterns in AML and normal hematopoietic cells. Leukemia. 2015 Jun;29(6):1279–89. - PMC - PubMed
    1. Argiropoulos B, Humphries RK. Hox genes in hematopoiesis and leukemogenesis. Oncogene. 2007 Oct 15;26(47):6766–76. - PubMed

MeSH terms