. 2016 Nov 1;116(5):2140-2151.
doi: 10.1152/jn.00518.2016. Epub 2016 Aug 17.

Developmental restoration of LTP deficits in heterozygous CaMKIIα KO mice

Affiliations

Developmental restoration of LTP deficits in heterozygous CaMKIIα KO mice

Dayton J Goodell et al. J Neurophysiol. .

Abstract

The Ca2+/calmodulin-dependent protein kinase II (CaMKII) is a major mediator of long-term potentiation (LTP) and depression (LTD), two opposing forms of synaptic plasticity underlying learning, memory and cognition. The heterozygous CaMKIIα isoform KO (CaMKIIα+/-) mice have a schizophrenia-related phenotype, including impaired working memory. Here, we examined synaptic strength and plasticity in two brain areas implicated in working memory, hippocampus CA1 and medial prefrontal cortex (mPFC). Young CaMKIIα+/- mice (postnatal days 12-16; corresponding to a developmental stage well before schizophrenia manifestation in humans) showed impaired hippocampal CA1 LTP. However, this LTP impairment normalized over development and was no longer detected in older CaMKIIα+/- mice (postnatal weeks 9-11; corresponding to young adults). By contrast, the CaMKIIα+/- mice failed to show the developmental increase of basal synaptic transmission in the CA1 seen in wild-type (WT) mice, resulting in impaired basal synaptic transmission in the older CaMKIIα+/- mice. Other electrophysiological parameters were normal, including mPFC basal transmission, LTP, and paired-pulse facilitation, as well as CA1 LTD, depotentiation, and paired-pulse facilitation at either age tested. Hippocampal CaMKIIα levels were ∼60% of WT in both the older CaMKIIα+/- mice and in the younger WT mice, resulting in ∼30% of adult WT expression in the younger CaMKIIα+/- mice; levels in frontal cortex were the same as in hippocampus. Thus, in young mice, ∼30% of adult CaMKIIα expression is sufficient for normal LTD and depotentiation, while normal LTP requires higher levels, with ∼60% of CaMKIIα expression sufficient for normal LTP in adult mice.

Keywords: CaMKII; LTD; LTP; schizophrenia; synaptic transmission.


Figures

Fig. 1.
Fig. 1.
Hippocampal CA1 LTP but not depotentiation or long-term depression (LTD) is impaired in the young p12–16 CaMKIIα+/− mice. Field excitatory postsynaptic potentials (fEPSPs) were recorded in the CA1 dendritic layer in response to CA1 Schaffer collateral stimulation. Long-term potentiation (LTP) was induced by high frequency stimulation (HFS; two 1 strains of 100-Hz stimulation separated by 20 s). LTD and depotentiation were induced by low -frequency stimulation (LFS; 900 pulses at 1 Hz). A: LTP and depotentiation plots and quantification from young p12–16 mice. Quantifications are from time points A, B, and C as indicated, representing a 20-min baseline, and last 10 min of LTP and depotentiation respectively. Right: example traces (average of 3 responses, representing 1 min) pre (black)- or post (grey)-HFS stimulation from time points A and B. B: depotentiation plot and quantification after renormalization to the last 10 min of LTP. Quantifications are from time points A and B as indicated, representing the renormalized last 10 min of LTP and the last 10 min of depotentiation. Right: example traces (average of 3 responses, representing 1 min) pre (black)- or post (grey)-LFS stimulation from time points A and B. LTP traces are the same as time point B traces in A. C: LTD plot and quantification from young postnatal day (p) 12–16 mice. Quantifications are from time points A and B as indicated, representing a 20-min baseline and last 10 min of LTD, respectively. Right: example traces (average of 3 responses, representing 1 min) pre (black)- or post (grey)-LFS from time points A and B. WT, wild type. **P < 0.01, ***P < 0.001 significantly different from prestimulus value indicating LTP, depotentiation, or LTD or as indicated between groups, one-way ANOVA followed by Tukey's honestly significant difference (HSD); NS, not significant.
Fig. 2.
Fig. 2.
Hippocampal CA1 LTP and depotentiation are normal in the older 9–11 wk CaMKIIα+/− mice. fEPSPs were recorded in the CA1 dendritic layer in response to CA1 Schaffer collateral stimulation. LTP was induced by HFS (two 1 strains of 100-Hz stimulation separated by 20 s). Depotentiation was induced by LFS (900 pulses at 1 Hz). A: LTP plot and quantification from 9–11 wk mice. Quantifications are from time points A and B as indicated, representing 20 min baseline, and last 10 min of LTP, respectively. Right: example traces (average of 3 responses, representing 1 min) pre (black)- or post (grey)-HFS from time points A and B. B: Depotentiation plot and quantification after renormalization to the last 10 min of LTP. Quantifications are from time points A and B as indicated, representing the renormalized last 10 min of LTP and the last ten min of depotentiation. Right: example traces (average of 3 responses, representing 1 min) pre (black)- or post (grey)-LFS from time points A and B. LTP traces are the same as time point B traces in A. ***P < 0.001, significantly different from pre stimulus value indicating LTP or depotentiation; NS, not significant, one-way ANOVA followed by Tukey's HSD.
Fig. 3.
Fig. 3.
Hippocampal CA1 paired-pulse ratio is normal in both young and older CaMKIIα+/− mice. Paired pulses (50-ms interpulse interval) were conducted at the beginning (after slice stabilization) and end of each experiment. A: quantification of paired-pulse ratio (first pulse/second pulse) from p12–16 young mice recorded at the beginning and end of each experiment. Right: example paired-pulse traces (average of 3 responses, representing 1 min) (pulse 1 black, pulse 2 grey) recorded at the beginning and end of each experiment. B: quantification of paired-pulse ratio (first pulse/second pulse) from 9–11 wk mice. Right: example traces (average of 3 responses, representing 1 min) (pulse 1 black, pulse 2 grey) recorded at the beginning and end of each experiment. C: percent amplitude of facilitation and decay during the first 50 pulses of 100-Hz stimuli used to induce LTP from young p12–16 mice. D: percent amplitude of facilitation and decay during the first 50 pulses of 100-Hz stimuli used to induce LTP from 9–11 wk mice. NS, not significant, one-way ANOVA for A and B, and for C, not significant at any pulse number by nonpaired, two-tailed t-test.
Fig. 4.
Fig. 4.
Additive effects of age and genotype on CaMKIIα expression in the hippocampus results in 4 times lower expression in the young CaMKIIα+/− mice. Hippocampal homogenates were made from p12–16 and 9–11 wk WT and CaMKIIα+/− mice (N = 3 for each age and genotype) and compared with SDS-PAGE and Western blot analysis for CaMKIIα and β, normalized to β-actin loading control. Densitometry is quantified as immunodetection value (IDV) normalized to values from 9–11 wk WT mice. A: representative blots. B: quantification of CaMKIIα expression. C: quantification of CaMKIIβ expression. *P < 0.05, **P < 0.01, ***P < 0.001, significantly different from 9–11 wk WT mice or between indicated groups; NS, not significant, two-way ANOVA (age × genotype) followed by Tukey's HSD; #main effect of age and different by t-test between respective ages but not significant by Tukey's HSD multiple comparison.
Fig. 5.
Fig. 5.
mPFC LTP and paired-pulse facilitation is normal in 9–11 wk CaMKIIα+/− mice. fEPSPs were recorded in mPFC layer 5 in response to layer 2–3 stimulation. LTP was induced by HFS (two 1 strains of 100-Hz stimulation separated by 20 s). Paired pulses (50-ms interpulse interval) were conducted at the beginning (after slice stabilization) and end of each experiment. A: LTP plots and quantification from young p12–16 mice. Quantifications are from time points A and B as indicated, representing 15 min baseline, and last 10 min of LTP respectively. Right: example traces (average of 3 responses, representing 1 min) pre (black)- or post (grey)-HFS stimulation from time points A and B. B: quantification of paired-pulse ratio (first pulse/second pulse). Right: example traces (average of 3 responses, representing 1 min) (pulse 1, black, pulse 2 grey) recorded at the beginning and end of each experiment. **P < 0.01, ***P < 0.001 significantly different from prestimulus value indicating LTP, one-way ANOVA followed by Tukey's HSD; NS, not significant.
Fig. 6.
Fig. 6.
Frontal cortex CaMKIIα expression does not differ from hippocampus in 9–11 wk mice. Hippocampal and frontal cortex homogenates were made from 9–11 wk WT and CaMKIIα+/− mice (N = 3 hippocampus and cortex were taken from same mouse) and compared with SDS-PAGE and Western blot analysis for CaMKIIα and β, normalized to β-actin loading control. Densitometry is quantified as immunodetection value (IDV) and normalized to values from WT hippocampus. A: representative blots. B: quantification of CaMKIIα expression. C: quantification of CaMKIIβ expression. *P < 0.05, **P < 0.01, two-way ANOVA (brain area × genotype) followed by Tukey's HSD; NS, not significant.
Fig. 7.
Fig. 7.
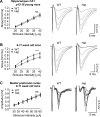
CaMKIIα+/− mice show a selective deficit in synaptic efficacy at the hippocampal CA1 synapse that develops with age. Input/output (I/O) curves were generated by increasing stimulus strength by 5 μA until responses leveled off or in hippocampus showed signs of population spiking. Regression analysis of the slope (mV/ms) of response vs. the corresponding stimulus intensity (μA) are compared; A–C include best fit lines for each genotype (left) and representative traces (right). A: I/O plot from hippocampus CA1 in p12–16 mice. B: I/O plot from hippocampus CA1 in 9–11 wk mice. C: I/O plot for mPFC layer 5 from 9–11 wk mice. ***P < 0.001, different curves are needed for each genotype; NS, one curve fits both genotypes, sum of squares F-test. For clarity, best-fit lines are shown for each genotype rather than one fit in A and C.

Similar articles

Cited by

References

    1. Anderson WW, Collingridge GL. The LTP Program: a data acquisition program for on-line analysis of long-term potentiation and other synaptic events. J Neurosci Methods 108: 71–83, 2001. - PubMed
    1. Barcomb K, Buard I, Coultrap SJ, Kulbe JR, O'Leary H, Benke TA, Bayer KU. Autonomous CaMKII requires further stimulation by Ca2+/calmodulin for enhancing synaptic strength. FASEB J 28: 3810–3819, 2014. - PMC - PubMed
    1. Barcomb K, Goodell DJ, Arnold DB, Bayer KU. Live imaging of endogenous Ca2+/calmodulin-dependent protein kinase II in neurons reveals that ischemia-related aggregation does not require kinase activity. J Neurochem 135: 666–673, 2015. - PMC - PubMed
    1. Barcomb K, Hell JW, Benke TA, Bayer KU. The CaMKII/GluN2B protein interaction maintains synaptic strength. J Biol Chem 291: 16082–16089, 2016. - PMC - PubMed
    1. Bayer KU, Löhler J, Schulman H, Harbers K. Developmental expression of the CaM kinase II isoforms: ubiquitous gamma- and delta-CaM kinase II are the early isoforms and most abundant in the developing nervous system. Brain Res Mol Brain Res 70: 147–154, 1999. - PubMed

Publication types

MeSH terms

Substances

LinkOut - more resources