. 2016 Oct 1;27(19):2965-79.
doi: 10.1091/mbc.E15-09-0634. Epub 2016 Aug 17.

Fascin regulates nuclear actin during Drosophila oogenesis

Affiliations

Fascin regulates nuclear actin during Drosophila oogenesis

Daniel J Kelpsch et al. Mol Biol Cell. .

Abstract

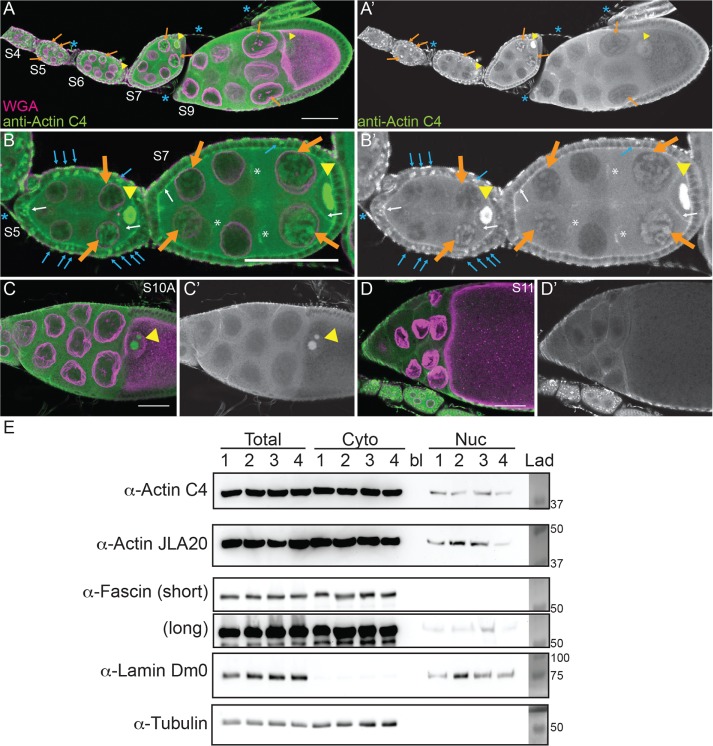
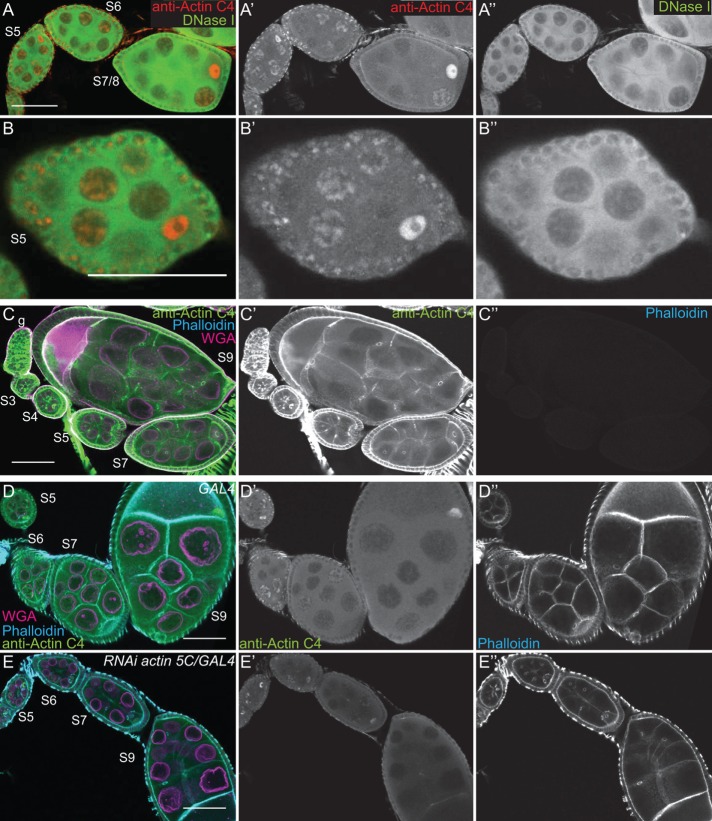
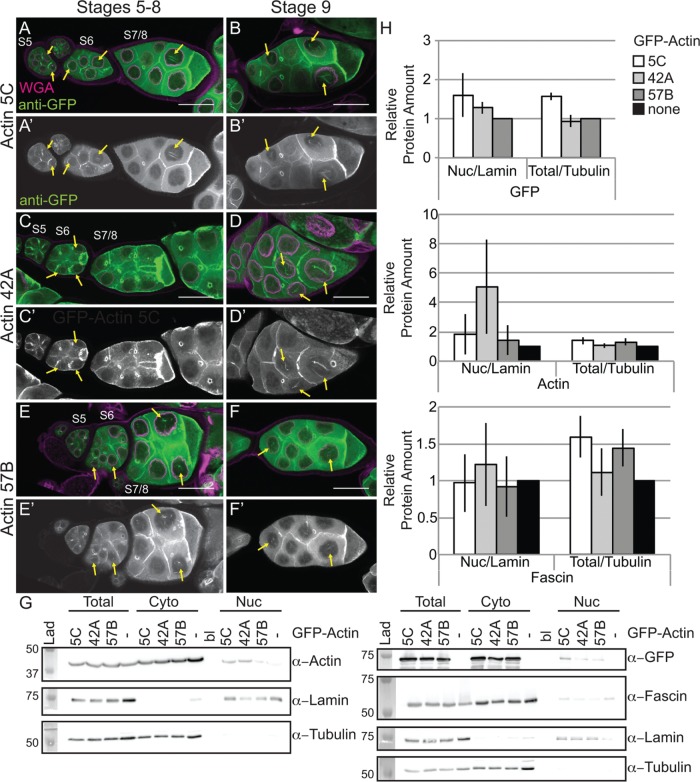
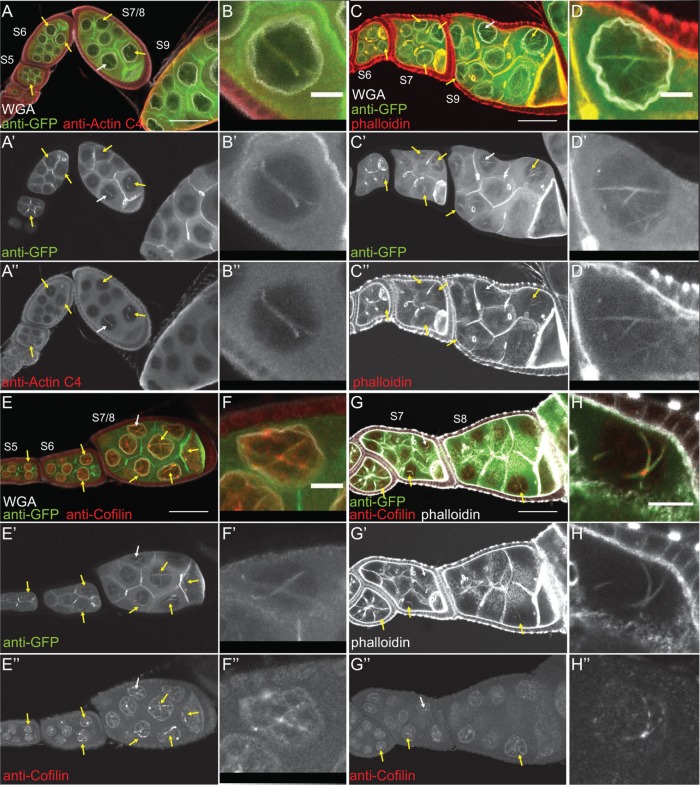
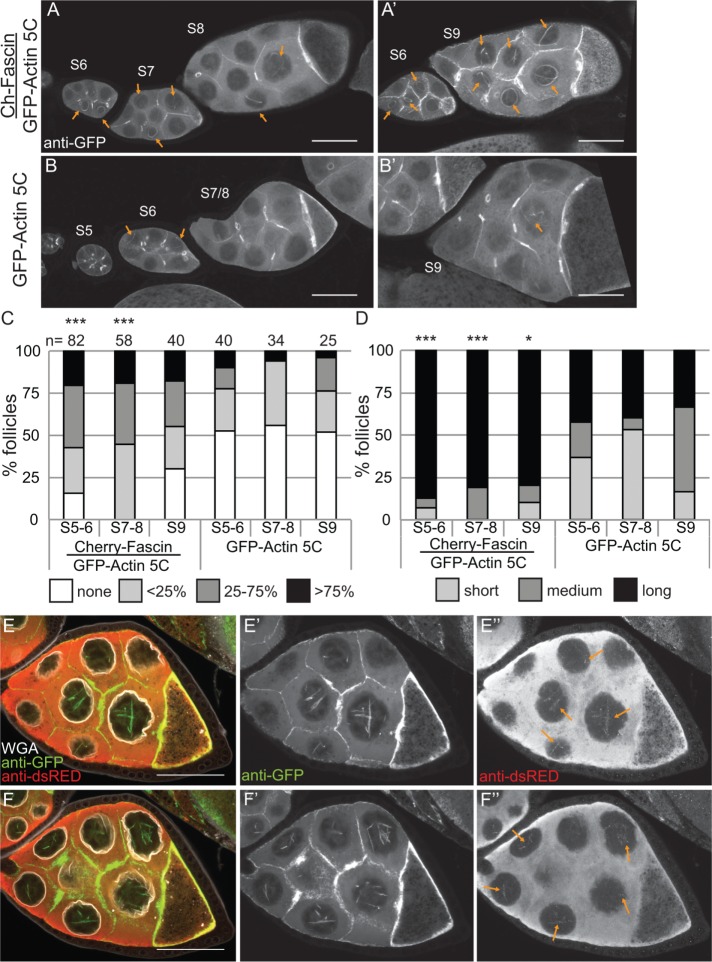
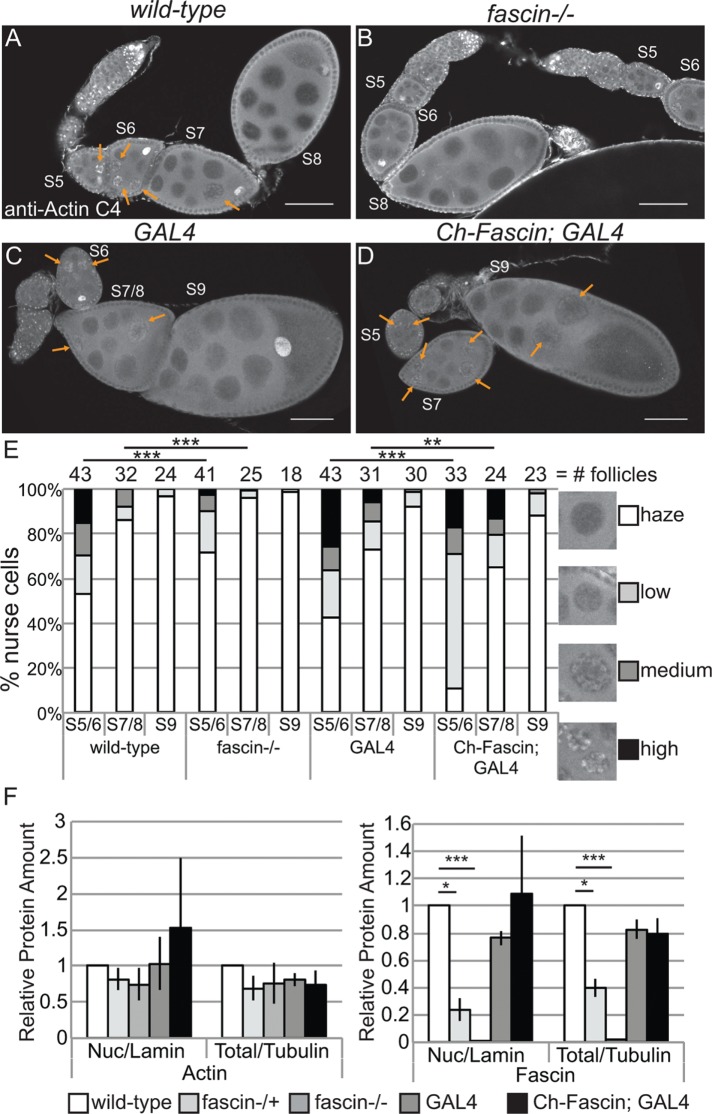
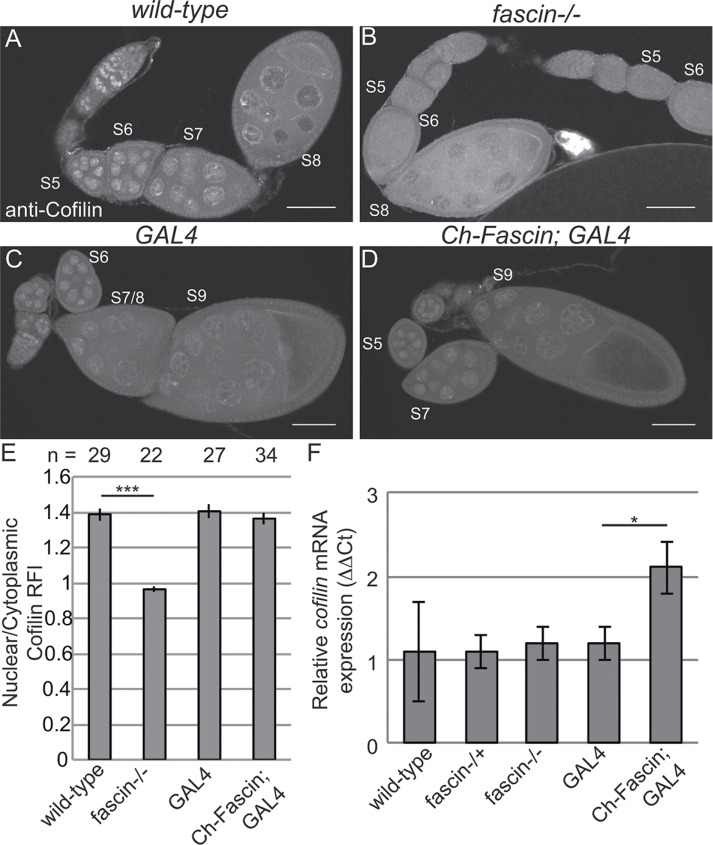
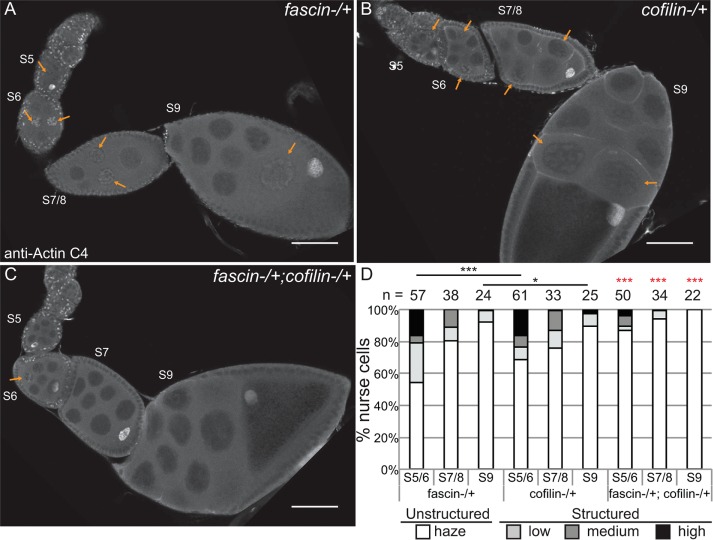
Drosophila oogenesis provides a developmental system with which to study nuclear actin. During Stages 5-9, nuclear actin levels are high in the oocyte and exhibit variation within the nurse cells. Cofilin and Profilin, which regulate the nuclear import and export of actin, also localize to the nuclei. Expression of GFP-tagged Actin results in nuclear actin rod formation. These findings indicate that nuclear actin must be tightly regulated during oogenesis. One factor mediating this regulation is Fascin. Overexpression of Fascin enhances nuclear GFP-Actin rod formation, and Fascin colocalizes with the rods. Loss of Fascin reduces, whereas overexpression of Fascin increases, the frequency of nurse cells with high levels of nuclear actin, but neither alters the overall nuclear level of actin within the ovary. These data suggest that Fascin regulates the ability of specific cells to accumulate nuclear actin. Evidence indicates that Fascin positively regulates nuclear actin through Cofilin. Loss of Fascin results in decreased nuclear Cofilin. In addition, Fascin and Cofilin genetically interact, as double heterozygotes exhibit a reduction in the number of nurse cells with high nuclear actin levels. These findings are likely applicable beyond Drosophila follicle development, as the localization and functions of Fascin and the mechanisms regulating nuclear actin are widely conserved.


Figures

FIGURE 1:
FIGURE 1:
Nuclear accumulation of actin is developmentally regulated. (A–D′) Maximum projections of two to four confocal slices of wild-type follicles. (A–D) Merged images of nuclear envelope (wheat germ agglutinin, WGA) in magenta and anti–actin C4 staining in green. (A′–D′) Anti–actin C4, white. Scale bars, 50 μm. The nurse cells during S5–9 exhibit varying levels of nuclear actin (A–B′), with some exhibiting structured actin (orange arrows) and others exhibiting a low haze of nuclear actin (unmarked). The germinal vesicles have very high levels of nuclear actin (A–C′, yellow arrowheads). In addition, actin is observed in the nuclei of a subset of the follicle cells during early oogenesis (B and B′, blue arrows). The actin C4 antibody also labels some F-actin structures, including the basal cortical actin of the follicle cells and the oocyte cortical actin during early oogenesis (B and B′, white arrows), the nurse cell cortical actin later in follicle development (>S10A; C–D′), ring canals (B and B′, white asterisks), and the muscle sheath (A–B′, blue asterisk). (E) Representative Western blots of subcellular fractionation with four independent samples, labeled 1–4, of whole ovary lysates from wild-type flies (total lysate, cytoplasmic fraction, nuclear fraction) blotted for actin (actin C4 and JLA20), Fascin (two exposures), Lamin Dm0 (nuclear marker), and α-Tubulin (cytoplasmic marker). bl, blank lane; Lad, ladder with molecular weight markers labeled. Actin and Fascin are found in the nuclear fraction of wild-type ovary lysates.
FIGURE 2:
FIGURE 2:
The actin C4 antibody recognizes Drosophila actin. (A–E′′) Maximum projections of two to four confocal slices of early stage wild-type follicles; images C–C′′ are of methanol-fixed follicles. (A, B) Merged images: anti–actin C4, red; DNase I, green. (A′, B′) Anti–actin C4, white. (A′′, B′′) DNase I, white. (C–E) Merged images: anti–actin C4, green; phalloidin, cyan; WGA, magenta. (C′–E′) Anti–actin C4, white. (C′′–E′′) Phalloidin, white. Scale bars, 50 μm. DNase I uniformly labels a blobby structure within the nurse cell nuclei (A, B, A′′, B′′), and the actin C4 antibody labels the same structure within a subset of the nuclei (A, B, A′, B′). Of note, DNase I does not label the germinal vesicle (A–B′′). On methanol fixation, the actin C4 antibody no longer labels the structured nuclear actin but instead labels F-actin structures within the follicles (C, C′); such fixation prevents phalloidin staining (C′′). RNAi-mediated knockdown of actin 5C within the germline results in decreased structured nuclear actin (anti–actin C4) and phalloidin staining of the cortical actin within the nurse cells, whereas both the antibody and phalloidin still label the muscle sheath and phalloidin strongly marks the cortical actin within the follicle cells (E–E′′ vs. D–D′′).
FIGURE 3:
FIGURE 3:
Cofilin and Profilin are present in the nurse cell nuclei. (A–B′′) Maximum projections of two to four confocal slices of wild-type early stage follicles. (A, B) Merged images of nuclear envelope (WGA) in magenta and antibody staining in green. (A–A′′) Anti-Cofilin. (B–B′′) Anti-Profilin. (A′′, B′′) Zoomed-in images of the regions boxed in A′ and B′, respectively. Scale bars, 50 μm (A, B), 10 μm (A′′, B′′). The levels of nuclear Cofilin (A–A′′) and Profilin (B–B′′) appear fairly constant during early oogenesis.
FIGURE 4:
FIGURE 4:
Germline expression of GFP-Actin induces nuclear actin rods. (A–F′) Maximum projections of two to four confocal slices of early follicles expressing the indicated GFP-Actin in the germline (matGAL4). (A–F) Merged images: WGA, magenta; anti-GFP, green. (A′–F′) Anti-GFP, white. Scale bars, 50 μm. Expression of GFP-Actin in the germline results in nuclear actin rod formation (A–F′, yellow arrows). (G) Representative Western blots of subcellular fractionation samples (total lysate, cytoplasmic fraction, nuclear fraction) from the indicated GFP-Actin or GAL4 only (–) blotted for GFP (GFP-Actin), actin (JLA20), Fascin, Lamin Dm0 (nuclear marker), and α-Tubulin (cytoplasmic marker). bl, blank lane; Lad, ladder. (H) Charts quantifying the relative amount of nuclear protein (actin, Fascin, or GFP-Actin) to nuclear Lamin and total protein (actin, Fascin, or GFP-Actin) to total Tubulin from Western blots of three subcellular fractionation experiments. For actin and Fascin values, protein amount was normalized to GAL4 only; GFP protein amount was normalized to GFP-Actin 57B. Error bars, SE. Nuclear and total levels of actin, Fascin, and GFP are not significantly different between GFP-Actin 5C, 42A, or 57B (p > 0.05, ordinary one-way analysis of variance).
FIGURE 5:
FIGURE 5:
Nuclear GFP-Actin rods are stable. (A–D) Representative example of FRAP experiments. Single-slice confocal images of GFP-Actin 5C (UAS GFP-Actin 5C; mat3Gal4) during FRAP time course showing prebleach, postbleach, middle, and endpoint. Scale bar, 10 μm. (E) Average FRAP recovery curve. Relative fluorescence intensity over time for nine different nuclei from five follicles. Error bars, SD. The nuclear GFP-Actin rods are stable, as the bleached region fails to recover.
FIGURE 6:
FIGURE 6:
Nuclear GFP-Actin rods contain Cofilin and label with phalloidin. (A–H′′) Maximum projections of two to four confocal slices of follicles from GFP-Actin 5C; matGAL4 females stained with the indicated antibodies and reagents. (A–F) Merged images: WGA, white; anti-GFP, green; other antibody or stain, red (A, B, anti–actin C4; C, D, phalloidin; E, F, anti-Cofilin). (G–H) Merged images: anti-GFP, green; phalloidin, white; anti-Cofilin, red. (B–B′′, D–D′′, F–F′′, H–H′′) Zoomed-in image of the actin rods pointed out by the white arrows in A–A′′, C–C′′, E–E′′, and G–G′′, respectively. Scale bars, 50 μm (A, C, E, G), and 10 μm (B, D, F, H). Nuclear GFP-Actin rods (yellow arrows) label with antibodies to nuclear actin (A–B′′) and Cofilin (E–F′′) and are weakly labeled by phalloidin (C–D′′). Costaining for both Cofilin and phalloidin reveals that the GFP-Actin rods exhibit regions that label with phalloidin, and in the weak phalloidin regions, the rods contain Cofilin (G–H′′).
FIGURE 7:
FIGURE 7:
Overexpression of Fascin enhances GFP-Actin rod formation. (A–B′) Maximum projections of two to four confocal slices of S5–9 follicles stained for GFP-Actin (anti-GFP). (A, A′). UAS mCherry-Fascin/GFP-Actin 5C; oskGAL4/+. (B, B′) GFP-Actin 5C/+; oskGAL4/+. Orange arrows indicate nuclear GFP-Actin rods. Scale bars, 50 μm. (C, D) Charts of the percentage of follicles of the indicated stages and transgenes expressed using oskGAL4 from 5- to 8-d-old females that exhibit particular frequencies and lengths of nuclear GFP-Actin rods; n values for both graphs are indicated across the top of the graph in C. Each follicle within a confocal stack was scored, in a genotypically blinded manner, for the percentage of nurse cells exhibiting nuclear actin rods (C; 0, ≤25, 25–75, or ≥75%) and the length of those rods (D; short, ≤1/4 of the nuclear diameter; medium, ∼1/2 diameter; or long, ≥1 diameter). Overexpression of Fascin enhances both the frequency and length of the nuclear actin rods in S5–6 and S7–8 but only the length during S9 compared with GFP-Actin alone during the same stages (***p < 0.001 and *p < 0.05, Pearson’s chi-squared test). (E–F′′) Maximum projections of two to four confocal slices of two different planes of a S8 UAS mCherry-Fascin/GFP-Actin 5C; oskGAL4/+ follicle. (E, F) Merged images: WGA, white; anti-GFP, green; anti-dsRed, red. (E′, F′) Anti-GFP, white. (E′′, F′′) Anti-dsRed, white. Scale bars, 50 μm. mCherry-Fascin labels nuclear GFP-Actin rods (orange arrows in E′′ and F′′).
FIGURE 8:
FIGURE 8:
Manipulating Fascin alters endogenous nuclear actin. (A–D) Maximum projections of two to four confocal slices of follicles of the indicated genotypes stained for endogenous nuclear actin (anti–actin C4). Scale bars, 50 μm. (E) Chart quantifying the percentage of nurse cells in S5–6, S7–8, and S9 of the indicated genotypes exhibiting unstructured or structured nuclear actin; the number of follicles (n) examined is indicated across the top of the chart. Each follicle within a confocal stack was scored, in a genotypically blinded manner, for the percentage of nurse cells exhibiting unstructured nuclear actin haze or low, medium, or high levels of structured nuclear actin. Loss of Fascin (fascinsn28/sn28) results in a low uniform haze of nuclear actin and a lack of structure compared with wild-type follicles (B vs. A, quantified in E; ***p < 0.001, Pearson’s chi-squared test), whereas overexpression of Fascin appears to increase the number of nurse cells exhibiting high levels of nuclear actin (orange arrows) compared with GAL4 alone (D vs. C, quantified in E; ***p < 0.001 and **p < 0.01, Pearson’s chi-squared test). (F) Charts quantifying the relative amount of nuclear protein (endogenous actin or endogenous Fascin) to nuclear Lamin and total protein (endogenous actin or endogenous Fascin) to total Tubulin in the indicated genotypes from Western blots of three subcellular fractionation experiments. Protein amount was normalized to wild-type. Error bars, SE. *p < 0.05 and ***p < 0.001, unpaired t test with Welch’s correction. Neither loss nor overexpression of Fascin significantly alters nuclear actin at the whole ovary level compared with their respective controls (fascin-/- to wild-type, p = 0.4; Ch-Fascin to GAL4, p = 0.7, unpaired t test with Welch’s correction).
FIGURE 9:
FIGURE 9:
Loss of Fascin reduces nuclear Cofilin levels. (A–D) Maximum projections of two to four confocal slices of follicles of the indicated genotypes stained for Cofilin; note that these are the same follicles shown in Figure 8. Scale bars, 50 μm. (E) Chart depicting the average nuclear-to-cytoplasmic relative fluorescence intensity of Cofilin in nurse cells from S7–8 follicles; the number of nurse cells (n) examined is indicated across the top of the chart. Briefly, the fluorescence intensity along a line traversing from the cytoplasm into the nucleus from two to three nurse cells from a minimum of seven different follicles from each genotype, in a genotypically blinded manner, was analyzed as described in Materials and Methods. Loss of Fascin significantly reduced the nuclear level of Cofilin, whereas overexpression of Fascin did not alter the distribution of Cofilin. Error bars, SE. ***p < 0.001, unpaired t test with Welch’s correction. (F) Chart depicting the normalized mRNA expression of cofilin from whole ovary preparations. Error bars, SE. Reduction of Fascin expression does not alter cofilin expression relative to wild-type. Overexpression of Fascin results in a significant increase in cofilin expression relative to its GAL4 control (Ch-Fascin to GAL4, p < 0.05, unpaired t test with Welch’s correction).
FIGURE 10:
FIGURE 10:
Fascin genetically interacts with Cofilin to regulate nuclear actin. (A–C) Maximum projections of two to four confocal slices of follicles stained for nuclear actin (anti–actin C4). (A) fascinsn28/ +, (B) cofilintsr1/+, and (C) fascinsn28/ +; cofilintsr1/+. Orange arrows indicate structured nuclear actin within the nurse cells. Scale bars, 50 μm. (D) Chart quantifying the percentage of nurse cells in S5–6, S7–8, and S9 of the indicated genotypes exhibiting unstructured or structured nuclear actin; the number of follicles (n) examined is indicated across the top of the chart. Each follicle within a confocal stack was scored, in a genotypically blinded manner, for the percentage of nurse cells exhibiting unstructured nuclear actin haze or low, medium or high levels of structured nuclear actin. Heterozygosity for a null allele of fascin has minimal effect on the frequency of nurse cells with structured nuclear actin levels, whereas heterozygosity for cofilin (Drosophila twinstar, tsr) exhibits reduced structured nuclear actin in S5/6 and S9 compared with fascin−/+ (A and B, quantified in D). Double heterozygotes for mutations in fascin and cofilin result in a striking reduction in the number of nurse cells with structured nuclear actin compared with either heterozygote alone (C vs. A and B; quantified in D); red asterisks indicate significant difference from both individual heterozygotes at the same stages. ***p < 0.001 and *p < 0.05; Fisher’s exact test.

References

    1. Abramoff M, Magalhaes P, Ram S. Image processing with ImageJ. Biophotonics Int. 2004;11:36–42.
    1. Agnew BJ, Minamide LS, Bamburg JR. Reactivation of phosphorylated actin depolymerizing factor and identification of the regulatory site. J Biol Chem. 1995;270:17582–17587. - PubMed
    1. Asumda FZ, Chase PB. Nuclear cardiac troponin and tropomyosin are expressed early in cardiac differentiation of rat mesenchymal stem cells. Differentiation. 2012;83:106–115. - PubMed
    1. Belin BJ, Cimini BA, Blackburn EH, Mullins RD. Visualization of actin filaments and monomers in somatic cell nuclei. Mol Biol Cell. 2013;24:982–994. - PMC - PubMed
    1. Belin BJ, Lee T, Mullins RD. DNA damage induces nuclear actin filament assembly by Formin -2 and Spire-(1/2) that promotes efficient DNA repair. [corrected] Elife. 2015;4:e07735. - PMC - PubMed

Publication types

LinkOut - more resources