. 2016 Nov 7;27(22):3616-3626.
doi: 10.1091/mbc.E16-06-0406. Epub 2016 Aug 17.

Automated analysis of filopodial length and spatially resolved protein concentration via adaptive shape tracking

Affiliations

Automated analysis of filopodial length and spatially resolved protein concentration via adaptive shape tracking

Tanumoy Saha et al. Mol Biol Cell. .

Abstract

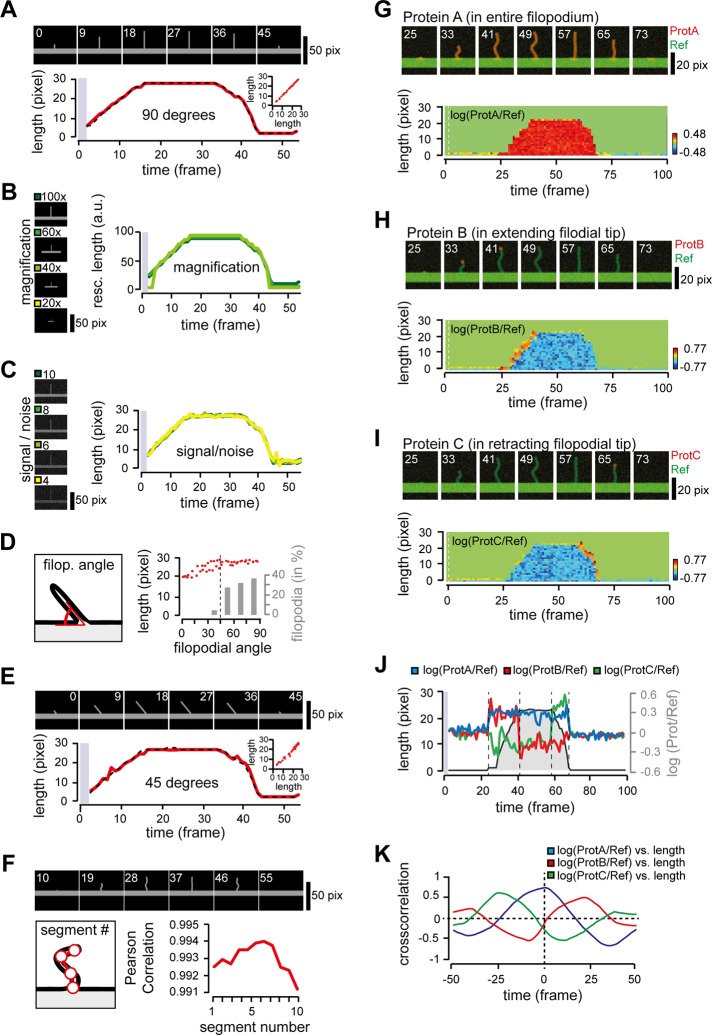
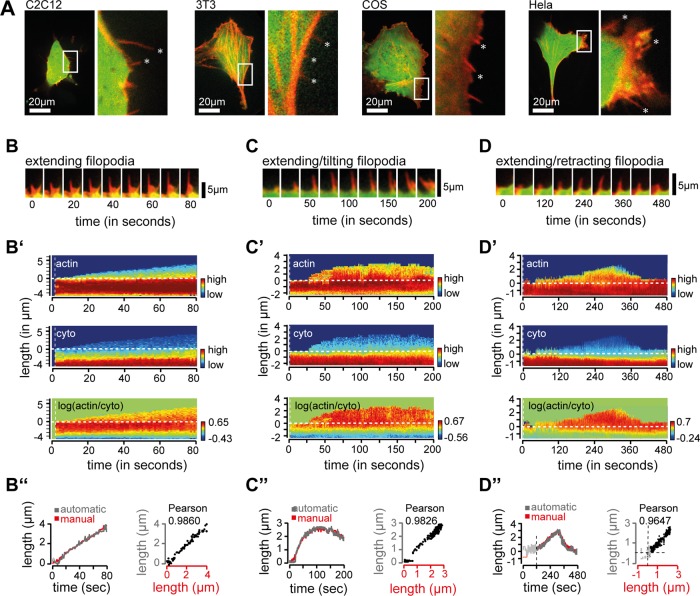
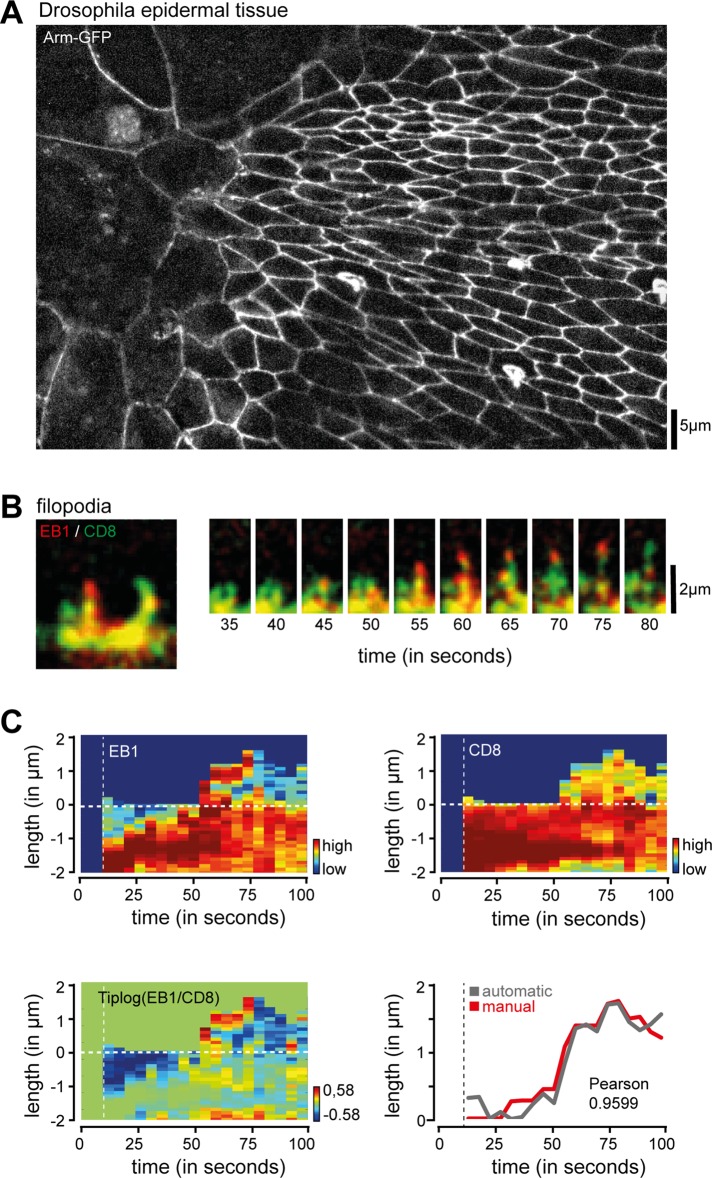
Filopodia are dynamic, actin-rich structures that transiently form on a variety of cell types. To understand the underlying control mechanisms requires precise monitoring of localization and concentration of individual regulatory and structural proteins as filopodia elongate and subsequently retract. Although several methods exist that analyze changes in filopodial shape, a software solution to reliably correlate growth dynamics with spatially resolved protein concentration along the filopodium independent of bending, lateral shift, or tilting is missing. Here we introduce a novel approach based on the convex-hull algorithm for parallel analysis of growth dynamics and relative spatiotemporal protein concentration along flexible filopodial protrusions. Detailed in silico tests using various geometries confirm that our technique accurately tracks growth dynamics and relative protein concentration along the filopodial length for a broad range of signal distributions. To validate our technique in living cells, we measure filopodial dynamics and quantify spatiotemporal localization of filopodia-associated proteins during the filopodial extension-retraction cycle in a variety of cell types in vitro and in vivo. Together these results show that the technique is suitable for simultaneous analysis of growth dynamics and spatiotemporal protein enrichment along filopodia. To allow readily application by other laboratories, we share source code and instructions for software handling.


Figures

FIGURE 1:
FIGURE 1:
Image analysis software to correlate protein recruitment kinetics and growth dynamics in filopodia. (A) Schematic representation of the working principle of the image analysis software. In step 1, the user selects the base and tip of the filopodia. In step 2, the software takes control and tracks the tip and shape of the filopodia. In step 3, ratiometric analysis is performed along the adapted filopodial backbones and data are exported. (B) Screenshot of convex-hull algorithm used by image analysis software to detect filopodial structures. (C) Schematic overview of filopodial extension–retraction cycle (top) and summary of the parameters that can be analyzed with the image analysis software (bottom).
FIGURE 2:
FIGURE 2:
In silico analysis of filopodial dynamics. (A) Analysis of protrusion length for a filopodium growing orthogonally from the base. Manually (dotted line) and automatically (red line) measured filopodial lengths. The image analysis software uses the first two frames for tracking adjustments (gray box). Inset, scatterplot analysis of manual (x-axis) and automatic (y-axis) measurements of filopodial length, with a Pearson r = 0.9996. (B) Analysis of filopodial growth dynamics using different objective magnifications. Left, an ∼2-μm-long filopodium in a constant field of view (96 × 72 pixel size) acquired with a 100× (dark green), 60× (green), 40× (light green), or 20× (yellow) objective using a CMOS camera with pixel size of 64,5 nm. Right, trace length rescaled before plotting according to the used magnification. Note that acquisition with a 20× objective (yellow) did not provide sufficient pixel resolution for image analysis and is thus missing. (C) Systematic changes in signal intensity show robust response of image analysis software. Filopodia with constant background noise (average 10; variance 10) and mean gray values of 100 (dark green), 80 (green), 60 (light green), and 40 (yellow) were analyzed. (D) Systematic changes in the tilting angle of filopodium with a constant length (left) show accurate length measurements (in red) for angles of >45° from the base. Analysis of angles at which filopodia emerge from dendrites in cultured hippocampal neurons is shown in gray bars. Cells were transfected at 8 d in vitro with a cytosolic marker and imaged 24 h later. Note that >95% of all filopodia emerge at an angle >45° from the dendrite axis (dashed vertical line). (E) Analysis of protrusion length for filopodium extending and retracting at exactly 45° from the base. Manually (dotted line) and automatically (red line) measured filopodial lengths. Inset, scatterplot analysis of manual (x-axis) and automatic (y-axis) measurements of filopodial length shows a Pearson r = 0.9940. (F) Measurement of filopodial length with increasing number of segments. Graph depicts Pearson’s r of manually vs. automatically measured filopodial length as a function of segment number. Note that segment number should not exceed the total filopodial length, as this will result in reduced measurement accuracy. (G–I) Examples of simulated signal enrichment showing a reference channel (green) together with signal channels (red) for enrichment of protein A in the entire filopodium (G), protein B only in the extending tip (H), and protein C only in the retracting tip (I). Bottom, quantification of relative protein signal intensity during the extension–retraction cycle, showing relative enrichment of protein A in the entire filopodium (G), of protein B in the extending tip (H), and of protein C in the retracting tip (I). The first two frames, used for tracking adjustments, are separated by the dashed white line. (J) Scatterplot of filopodial length during the extension–retraction cycle (black) and the relative intensity for the three most distal pixels of the protrusions for proteins A (blue line), B (red line), and C (green line). (K) Cross-correlation analysis for filopodial length and average signal of the three most distal pixels of proteins A (blue line), B (red line), and C (green line). Scale bars, 50 pixels (A, E, F), 20 pixels (G–I).
FIGURE 3:
FIGURE 3:
In vitro analysis of filopodial dynamics in cultured cells. (A) Test for filopodia formation in cultured COS, C2C12, HeLa, and 3T3 cells. Individual cell lines were transfected with f-tractin (red), a marker for filamentous actin, and a cytosolic reference (green). (B) Filopodium forming on COS cells. Time series of COS cell transfected with f-tractin and a cytosolic reference. (B′) Analysis of filopodial growth dynamics and relative protein concentration of f-tractin (top) and cytosolic reference (middle) and ratio of f-tractin vs. cytosolic reference (bottom). The first two frames, used for tracking adjustments, are separated by the vertical dashed white line. (B′′) Analysis of alignment accuracy. Bottom left, overlay of automatically (gray) and manually (red) traced filopodia. Scatter plot analysis of manual (x-axis, red) and automatic (y-axis, gray) measurements of filopodial length show a Pearson r = 0.9860. (C) Filopodium forming and tilting; time-series analysis, as before. Protein concentration (C′) and comparison of manual and automatic filopodial length (C′′). (D) Filopodium forming and retracting, time-series analysis, as before. Protein concentration (D′) and comparison of manual and automatic filopodial length (D′′). Note that values from 0–120 s before filopodial initiation (D′′, gray) were not used for Pearson r. Scale bars, 20 μm (A), 5 μm (B–D).
FIGURE 4:
FIGURE 4:
In vitro analysis of filopodial dynamics in cultured hippocampal neurons. (A) Representative image of primary hippocampal neuron. Neuron was transfected with fluorescent marker 14 d after plating and imaged 24 h later. (B) Dendritic protrusions can be divided into transient (filopodium, top) and static (spine, bottom) protrusions. (C) Vertical kymograph of filopodium (top) and spine (bottom) show differences in growth dynamics. (D) Horizontal kymograph of filopodium (left) and spine (right). Note that both protrusions show substantial lateral movement. (E) Time series of a filopodium forming on the dendrite shaft (top) and measurements using the image analysis software (bottom). (F) Differences in filopodial dynamics upon overexpression of constitutively active Rho GTPases in neurons. Time series of filopodia forming on a neuron transfected with control (black), constitutively active Cdc42 (blue), and constitutively active Rac1 (red). Note the differences in length and lifetime. (G) F-BAR domain of srGAP2 is enriched in the filopodium. Time series of neurons transfected at day in vitro (DIV) 8 with a construct encoding the F-BAR domain of srGAP2 (red) and a cytosolic reference (green) and imaged 24 h later. (G′) Analysis of growth dynamics and relative protein concentration of the F-BAR domain of srGAP2 (top), cytosolic reference (middle), and ratio of F-BAR domain of srGAP2 vs. cytosolic reference (bottom). The first two frames, used for tracking adjustments, are separated by the vertical dashed white line. (G′′) Analysis of srGAP2 recruitment (red) and filopodial elongation (blue) during the extension–retraction cycle. Note that enrichment of the F-BAR domain of srGAP2 and filopodia formation coincide. (H) Actin enrichment precedes filopodia elongation. Time series of cell transfected at DIV 8 with f-tractin (red) and a cytosolic reference (green) and imaged 24h later. Note the formation of actin-rich patches before filopodia elongation. (H′) Analysis of growth dynamics and relative protein concentration of actin (top), cytosolic reference (middle), and ratio of actin vs. cytosolic reference (bottom). (H′′) Analysis of actin recruitment (red) and filopodia elongation (blue) during the extension–retraction cycle. Note that actin-enrichment precedes filopodia formation. Scale bars, 50 μm (A), 2 μm (B, C, F), 500 nm (D), 1 μm (E), 5 μm (G, H).
FIGURE 5:
FIGURE 5:
In vivo analysis of filopodial dynamics in epithelial sheets. (A) Migrating cells in epithelial sheet of Drosophila abdomen. Individual cell boundaries were visualized with Arm-GFP. (B) Time series of cells expressing EB1 (red) and membrane marker CD8 (green) during filopodial elongation. Note the enrichment of the microtubule plus-end marker EB1 in elongating structures. (C) Analysis of growth dynamics and relative protein concentration for EB1 (top left), CD8 (top right), and ratio of EB1 vs. CD8 (bottom left). Bottom right, overlay of automatically (gray) and manually (red) traced filopodial length. The first two frames, used for tracking adjustments, are separated by the vertical dashed line. Scale bars, 5 μm (A), 2 μm (B).
FIGURE 6:
FIGURE 6:
Limitations of image analysis software. (A) Scanning electron microscope images of HeLa cell. Note the large amount of filopodial structures covering the surface. (B) HeLa cell transfected with filamentous actin. Confocal section of cell (top), kymograph of line scan through filopodia (middle), and color-coded overlay of time series (bottom). Note the substantial amount of filopodial movement. (C) Image analysis of long-lived filopodia. Time series of cells transfected with f-tractin (red) and cytosolic marker (green), as well as plot depicting analysis of filopodial growth dynamics and relative concentration of f-tractin along the filopodium. The first two frames, used for tracking adjustments, are separated by the vertical dashed white line. No change in length was visible during the acquisition interval. (D) Filopodia buckling during image acquisition. Time series and analysis as before. Note the strong differences in fluorescence intensity due to helical buckling of the filopodium. (E) Filopodia leaving the confocal plane. Time series and analysis. Scale bars, 10 μm (A, left), 4 μm (A, right), 10 μm (B, top), 2 μm (B, middle and bottom), 5 μm (C–E).

References

    1. Abramoff MD, Magalhaes PJ, Ram SJ. Image processing with ImageJ. Biophotonics Int. 2004;11:36–42.
    1. Argiro V, Bunge MB, Johnson MI. A quantitative study of growth cone filopodial extension. J Neurosci Res. 1985;13:149–162. - PubMed
    1. Barry DJ, Durkin CH, Abella JV, Way M. Open source software for quantification of cell migration, protrusions, and fluorescence intensities. J Cell Biol. 2015;209:163-180. - PMC - PubMed
    1. Best A, Ahmed S, Kozma R, Lim L. The Ras-related GTPase Rac1 binds tubulin. J Biol Chem. 1996;271:3756–3762. - PubMed
    1. Blum H. A transformation for extracting new descriptors of shape. In: Wathen-Dunn W, editor. Models for the Perception of Speech and Visual Form: Proceedings of a Symposium; Cambridge, MA. MIT Press; 1967. pp. 362–380.

Publication types

LinkOut - more resources