Computing energy landscape maps and structural excursions of proteins
- PMID: 27535545
- PMCID: PMC5001232
- DOI: 10.1186/s12864-016-2798-8
Computing energy landscape maps and structural excursions of proteins
Abstract
Background: Structural excursions of a protein at equilibrium are key to biomolecular recognition and function modulation. Protein modeling research is driven by the need to aid wet laboratories in characterizing equilibrium protein dynamics. In principle, structural excursions of a protein can be directly observed via simulation of its dynamics, but the disparate temporal scales involved in such excursions make this approach computationally impractical. On the other hand, an informative representation of the structure space available to a protein at equilibrium can be obtained efficiently via stochastic optimization, but this approach does not directly yield information on equilibrium dynamics.
Methods: We present here a novel methodology that first builds a multi-dimensional map of the energy landscape that underlies the structure space of a given protein and then queries the computed map for energetically-feasible excursions between structures of interest. An evolutionary algorithm builds such maps with a practical computational budget. Graphical techniques analyze a computed multi-dimensional map and expose interesting features of an energy landscape, such as basins and barriers. A path searching algorithm then queries a nearest-neighbor graph representation of a computed map for energetically-feasible basin-to-basin excursions.
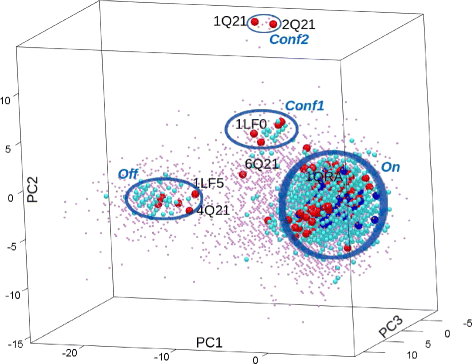
Results: Evaluation is conducted on intrinsically-dynamic proteins of importance in human biology and disease. Visual statistical analysis of the maps of energy landscapes computed by the proposed methodology reveals features already captured in the wet laboratory, as well as new features indicative of interesting, unknown thermodynamically-stable and semi-stable regions of the equilibrium structure space. Comparison of maps and structural excursions computed by the proposed methodology on sequence variants of a protein sheds light on the role of equilibrium structure and dynamics in the sequence-function relationship.
Conclusions: Applications show that the proposed methodology is effective at locating basins in complex energy landscapes and computing basin-basin excursions of a protein with a practical computational budget. While the actual temporal scales spanned by a structural excursion cannot be directly obtained due to the foregoing of simulation of dynamics, hypotheses can be formulated regarding the impact of sequence mutations on protein function. These hypotheses are valuable in instigating further research in wet laboratories.
Keywords: Energy landscape map; Evolutionary algorithm; Low-cost paths; Mechanical work; Multi-basin energy landscape; Multi-state protein; Nearest-neighbor graph; Protein equilibrium dynamics; Sample-based representation; Structural excursion.
Figures

Similar articles
-
Attenuating dependence on structural data in computing protein energy landscapes.BMC Bioinformatics. 2019 Jun 6;20(Suppl 11):280. doi: 10.1186/s12859-019-2822-5. BMC Bioinformatics. 2019. PMID: 31167640 Free PMC article.
-
From Optimization to Mapping: An Evolutionary Algorithm for Protein Energy Landscapes.IEEE/ACM Trans Comput Biol Bioinform. 2018 May-Jun;15(3):719-731. doi: 10.1109/TCBB.2016.2628745. Epub 2016 Nov 15. IEEE/ACM Trans Comput Biol Bioinform. 2018. PMID: 28113951
-
Structure-Guided Protein Transition Modeling with a Probabilistic Roadmap Algorithm.IEEE/ACM Trans Comput Biol Bioinform. 2018 Nov-Dec;15(6):1783-1796. doi: 10.1109/TCBB.2016.2586044. Epub 2016 Jul 7. IEEE/ACM Trans Comput Biol Bioinform. 2018. PMID: 27411226
-
Protein functional landscapes, dynamics, allostery: a tortuous path towards a universal theoretical framework.Q Rev Biophys. 2010 Aug;43(3):295-332. doi: 10.1017/S0033583510000119. Epub 2010 Sep 7. Q Rev Biophys. 2010. PMID: 20819242 Review.
-
Taming Rugged Free Energy Landscapes Using an Average Force.Acc Chem Res. 2019 Nov 19;52(11):3254-3264. doi: 10.1021/acs.accounts.9b00473. Epub 2019 Nov 4. Acc Chem Res. 2019. PMID: 31680510 Review.
Cited by
-
Computational Structural Biology: Successes, Future Directions, and Challenges.Molecules. 2019 Feb 12;24(3):637. doi: 10.3390/molecules24030637. Molecules. 2019. PMID: 30759724 Free PMC article. Review.
-
Generative Adversarial Learning of Protein Tertiary Structures.Molecules. 2021 Feb 24;26(5):1209. doi: 10.3390/molecules26051209. Molecules. 2021. PMID: 33668217 Free PMC article.
-
Attenuating dependence on structural data in computing protein energy landscapes.BMC Bioinformatics. 2019 Jun 6;20(Suppl 11):280. doi: 10.1186/s12859-019-2822-5. BMC Bioinformatics. 2019. PMID: 31167640 Free PMC article.
-
Data Size and Quality Matter: Generating Physically-Realistic Distance Maps of Protein Tertiary Structures.Biomolecules. 2022 Jun 29;12(7):908. doi: 10.3390/biom12070908. Biomolecules. 2022. PMID: 35883464 Free PMC article.
-
Structure-based protein and small molecule generation using EGNN and diffusion models: A comprehensive review.Comput Struct Biotechnol J. 2024 Jun 26;23:2779-2797. doi: 10.1016/j.csbj.2024.06.021. eCollection 2024 Dec. Comput Struct Biotechnol J. 2024. PMID: 39050782 Free PMC article. Review.
References
-
- Schroedinger E. What Is Life? New York: Cambridge University Press; 1944.
Publication types
MeSH terms
Substances
LinkOut - more resources
Full Text Sources
Other Literature Sources

