. 2016 Aug 17:17:650.
doi: 10.1186/s12864-016-2944-3.

A new transcriptome and transcriptome profiling of adult and larval tissue in the box jellyfish Alatina alata: an emerging model for studying venom, vision and sex

Affiliations

A new transcriptome and transcriptome profiling of adult and larval tissue in the box jellyfish Alatina alata: an emerging model for studying venom, vision and sex

Cheryl Lewis Ames et al. BMC Genomics. .

Erratum in

Abstract

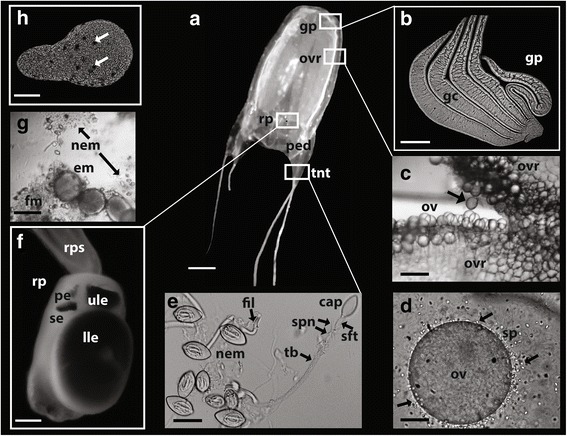
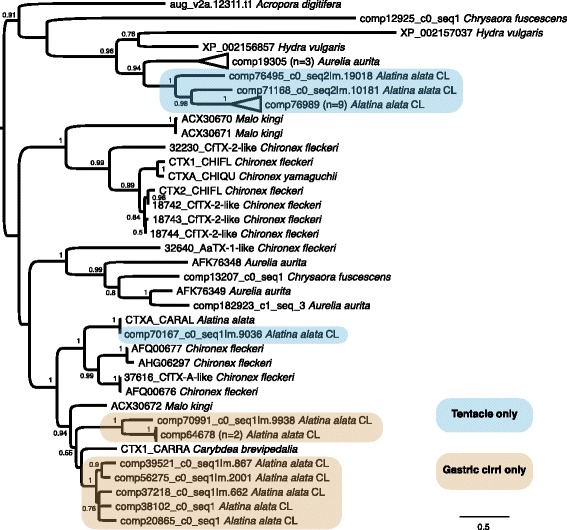
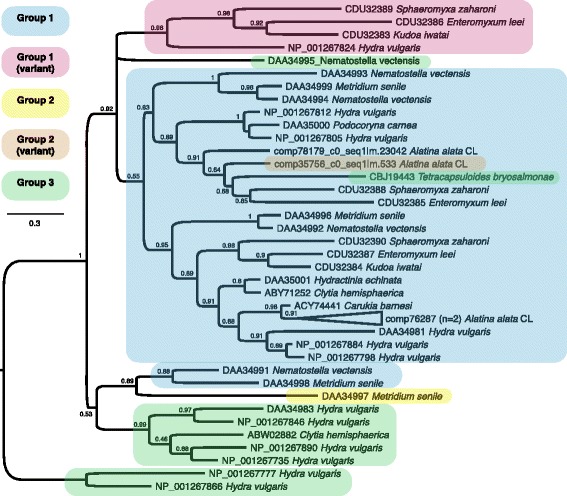
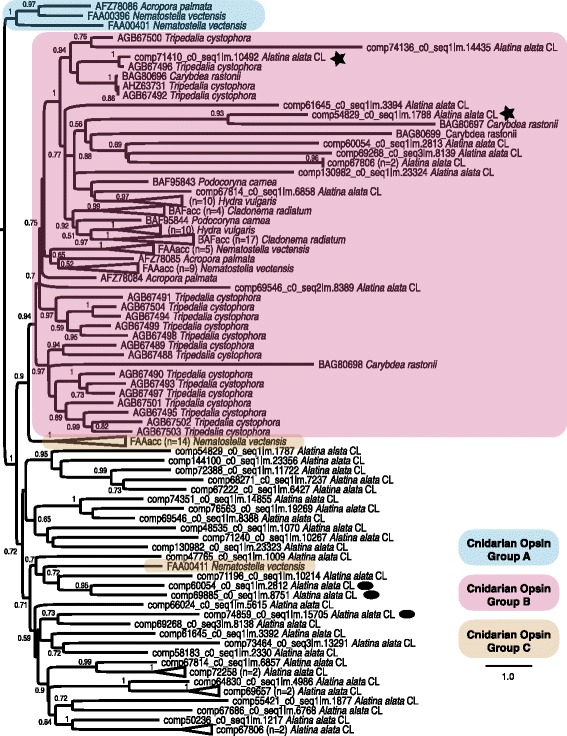
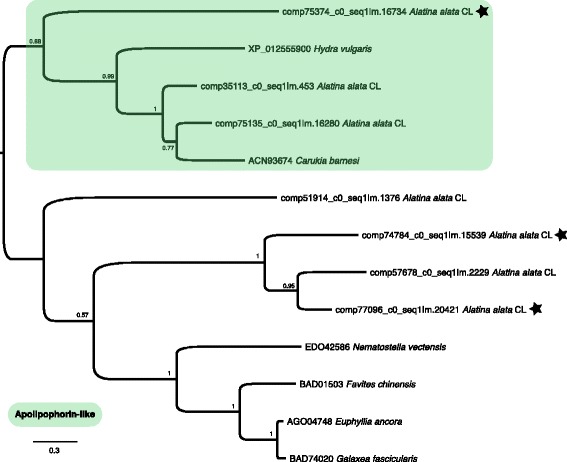
Background: Cubozoans (box jellyfish) are cnidarians that have evolved a number of distinguishing features. Many cubozoans have a particularly potent sting, effected by stinging structures called nematocysts; cubozoans have well-developed light sensation, possessing both image-forming lens eyes and light-sensitive eye spots; and some cubozoans have complex mating behaviors, including aggregations, copulation and internal fertilization. The cubozoan Alatina alata is emerging as a cnidarian model because it forms predictable monthly nearshore breeding aggregations in tropical to subtropical waters worldwide, making both adult and larval material reliably accessible. To develop resources for A. alata, this study generated a functionally annotated transcriptome of adult and larval tissue, applying preliminary differential expression analyses to identify candidate genes involved in nematogenesis and venom production, vision and extraocular sensory perception, and sexual reproduction, which for brevity we refer to as "venom", "vision" and "sex".

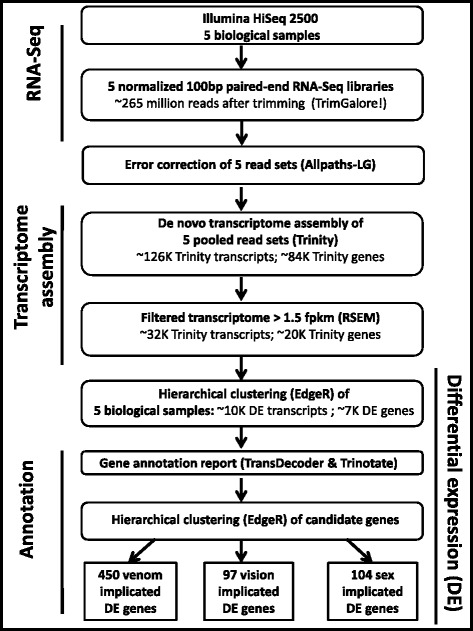
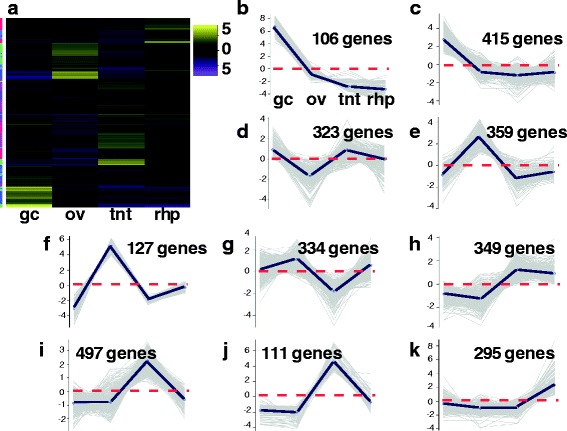
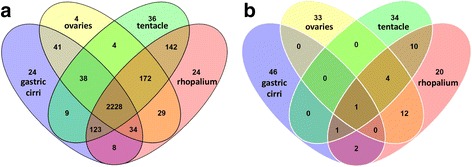
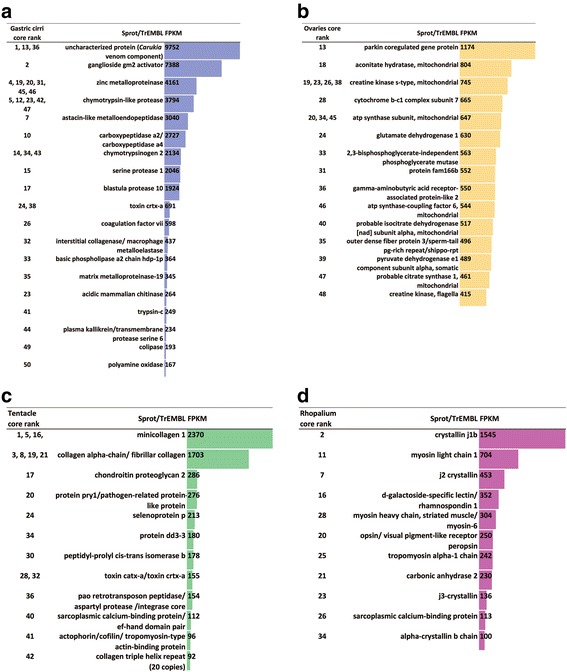
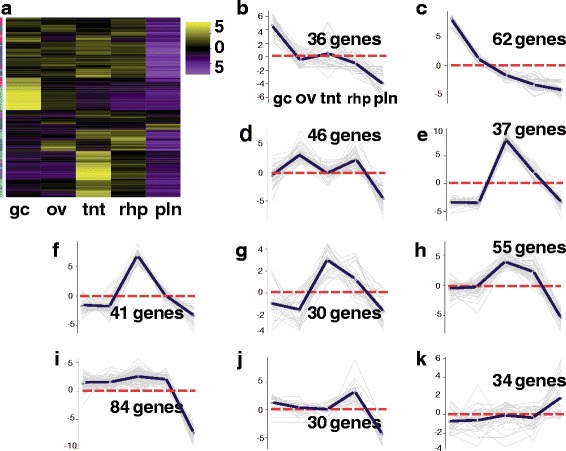
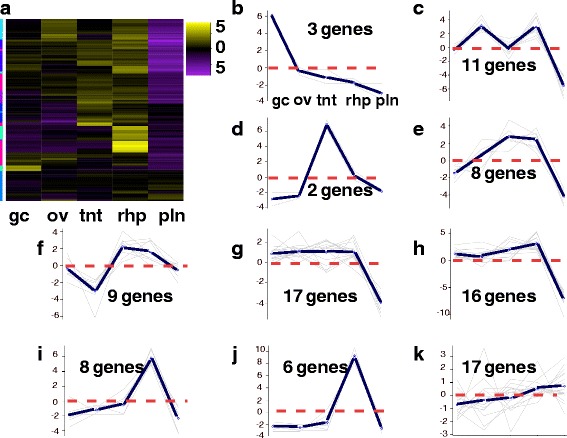
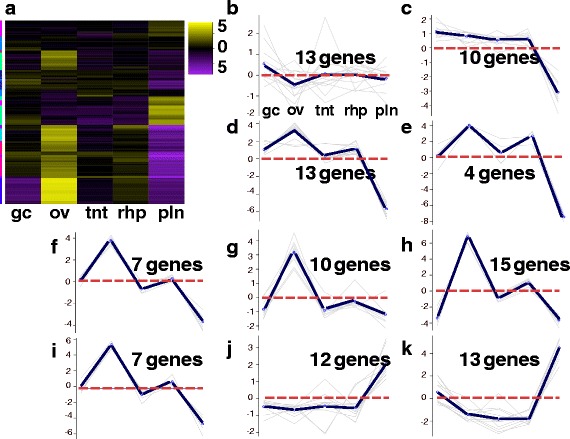
Results: We assembled a transcriptome de novo from RNA-Seq data pooled from multiple body parts (gastric cirri, ovaries, tentacle (with pedalium base) and rhopalium) of an adult female A. alata medusa and larval planulae. Our transcriptome comprises ~32 K transcripts, after filtering, and provides a basis for analyzing patterns of gene expression in adult and larval box jellyfish tissues. Furthermore, we annotated a large set of candidate genes putatively involved in venom, vision and sex, providing an initial molecular characterization of these complex features in cubozoans. Expression profiles and gene tree reconstruction provided a number of preliminary insights into the putative sites of nematogenesis and venom production, regions of phototransduction activity and fertilization dynamics in A. alata.

Conclusions: Our Alatina alata transcriptome significantly adds to the genomic resources for this emerging cubozoan model. This study provides the first annotated transcriptome from multiple tissues of a cubozoan focusing on both the adult and larvae. Our approach of using multiple body parts and life stages to generate this transcriptome effectively identified a broad range of candidate genes for the further study of coordinated processes associated with venom, vision and sex. This new genomic resource and the candidate gene dataset are valuable for further investigating the evolution of distinctive features of cubozoans, and of cnidarians more broadly.

Keywords: Cubozoa; Embryo; Expression patterns; Eye; Gametogenesis; Pedalium; Planulae; Spawning aggregations; Sperm; Sting.


Figures

Fig. 1
Fig. 1
a-h Morphology of A. alata mature female medusa similar to that collected and subsampled for de novo transcriptome assembly in this study. White boxes correspond to the location of medusa body parts sub-sampled. a Mature A. alata medusa (live). b A portion of a gastric phacella removed from a live medusa, with five individual gastric cirri. c Ovulation documented within the female gastrovascular cavity; arrow indicates imminent release of teardrop shaped ovum. d Interaction between recently ovulated egg and spermatozoa (arrows) in the fluid examined from the gastrovascular cavity (representing putative fertilization). e Intact nematocysts (euryteles with associated filaments) on the left, and a discharged eurytele on the right, isolated from the tentacle. f Rhopalium connected to the rhopaliar stalk showing upper and lower lens eyes, and lateral pit and slit eyes (one of each pair visible). g Bundles of blastulae released by females entangled in fibrous material and intact eurytele nematocysts. h Swimming planula (within 20 h of blastula release from the female); arrows indicating planulae eyes spots. Abbreviations: cap = capsule of nematocyst; em = embryos; fil = filaments; fm = fibrous material, gc = gastric cirri; gp = gastric phacella (comprised of numerous gastric cirri); nem = nematocyst (birhopaloids)s; ov = ovum (ova); ovr = ovaries; pe = pit eye; ped = pedalium; rp = rhopalium; rps = rhopaliar stalk; se = slit eye; sp = sperm; sft = shaft of nematocyst tubule; spn = spines of nematocyst shaft; tb = tubule of discharged nematocyst; tnt = tentacle. Scale bars: a = ~15 mm, b = ~0.5 mm, c = ~250 μm, d = ~30 μm, e = ~20 μm, f = ~0.2 mm, g = ~100 μm, h = ~30 μm
Fig. 2
Fig. 2
Flowchart of methodology used in transcriptome assembly, gene annotation and differential expression of the five A. alata samples analyzed in this study. Additional details provided in Results and Methods. Figure modelled after [47]
Fig. 3
Fig. 3
a-k Heatmap of A. alata medusa samples. Hierarchical clustering (EdgeR) and corresponding ten subcluster profiles for the 2916 genes differentially expressed across A. alata medusa samples (gastric cirri, ovaries, tentacle (with pedalium base), rhopalium) (of the identified ~20 K Trinity genes. Intensity of color indicates expression levels for each of the ten hierarchical clusters (vertical access). Bright yellow patches correspond to the highest peaks for each k-mean subcluster profile. K-mean profiles (b-k) match the order of column names in a, representing the mean expression of gene clusters highly abundant in each sample (centroid demarcated by the solid line; zero indicated by the horizontal dashed red line). Three bright yellow transcript clusters in the gastric cirri column correspond to each of the peaks seen in plots b, c and d in the ovaries column correspond to plots e, f, g and in the tentacle column correspond to h, i, j, while the two bright yellow clusters in the rhopalium column correspond to peaks in plots k, and to the less prominent peaks in plots g and h. The vertical colored bar on the left of the heatmap (a) indicates distinct patterns corresponding to the ten subcluster profiles (sc = subcluster number), for which the number of genes each comprises is indicated. Abbreviations: gc = gastric cirri, ov = ovaries, tnt = tentacle (and pedalium base), rhp = rhopalium, and pln = planulae. (Original matrix in Additional file 5)
Fig. 4
Fig. 4
a, b Venn diagrams showing overlap of genes differentially expressed exclusively in A. alata medusa samples (gastric cirri, ovaries, tentacle, rhopalium). a Shows that of the 2916 total genes differentially expressed across the four samples 2228 (76 %) are expressed in all samples, 24 are unique to gastric cirri, 4 are unique to ovaries, 38 are unique to the tentacle, and 24 are unique to the rhopalium. b Shows that of the top 50 most highly differentially expressed genes by sample type, a single gene is expressed in all four samples. The subset of genes unique to the top 50 most abundant genes by sample, called the “core genes” herein, comprises 46 genes in the gastric cirri, 33 in the ovaries, 34 in the tentacle (and pedalium base), and 20 in the rhopalium. Core gene annotations provided in Additional file 6 and summarized in histograms Fig. 6a-d
Fig. 5
Fig. 5
a-d Abundances of annotated “core genes” in the A. alata transcriptome according to medusa sample. Column headings correspond to rank(s) among the top 50 of each core gene (or gene family) by sample according to the Venn diagram in Fig. 4b, protein annotation from UniProtKB SwissProt (Sprot) and TrEMBL (separated by a back slash) and fpkm values in a gastric cirri, b ovaries, c tentacle (and pedalium base), d rhopalium. Genes with putative functions in sperm motility are indicated with asterisks (*) in b. Genes lacking Trinotate annotations are not included. Detailed statistics (fpkm, counts, DE values for top 50 ranked genes by sample with annotations) provided in Additional file 6)
Fig. 6
Fig. 6
a-k Venom Heatmap for A. alata. Hierarchical clustering (EdgeR) and corresponding ten subcluster profiles for the 455 genes implicated in venom differentially expressed across A. alata medusa (gastric cirri, ovaries, tentacle (with pedalium base), rhopalium) and planulae samples. Intensity of color indicates expression levels for each of the ten hierarchical clusters (vertical access). Bright yellow patches correspond to the highest peaks for each k-mean subcluster profile. K-mean profiles (b-k) match the order of column names in a, representing the mean expression of gene clusters highly abundant in each sample (centroid demarcated by the solid line; zero indicated by the horizontal dashed red line). Two bright yellow transcript clusters in the gastric cirri column correspond to peaks in plots b and c; one cluster in the ovaries column corresponds to plot d; four clusters in the tentacle column correspond to plots e, f, g and h; one cluster in the rhopalium corresponds to plot j and to the less prominent peak seen in plot i; one cluster in the planulae column corresponds to plot k. The vertical colored bar on the left of the heatmap (a) indicates distinct patterns corresponding to the ten subcluster profiles (sc = subcluster number), for which the number of genes each comprises is indicated. Abbreviations: gc = gastric cirri, ov = ovaries, tnt = tentacle (and pedalium base), rhp = rhopalium, and pln = planulae. Gene annotations by subcluster provided in Additional file 7
Fig. 7
Fig. 7
a-k Vision Heatmap for A. alata. Hierarchical clustering (EdgeR) and corresponding ten subcluster profiles for the 97 genes implicated in vision and the phototransduction pathway differentially expressed across A. alata medusa (gastric cirri, ovaries, tentacle (with pedalium base), rhopalium) and planulae samples. Intensity of color indicates expression levels for each of the ten hierarchical clusters (vertical access). Bright yellow patches correspond to the highest peaks for each k-mean subcluster profile. K-mean profiles (b-k) match the order of column names in a, representing the mean expression of gene clusters highly abundant in each sample (centroid demarcated by the solid line; zero indicated by the horizontal dashed red line). One bright yellow transcript clusters in the gastric cirri column correspond to a peak in plot b; one cluster in the ovaries column corresponds to plot c; three clusters in the tentacle column correspond to plots d, e and f; three bright yellow clusters in the rhopalium column correspond to peaks in plots h, i and j, and two less intense clusters correspond to peaks in plots g and k, and a slightly intense yellow gene cluster in the planulae column corresponds to the peak in plot k. The vertical colored bar on the left of the heatmap (a) indicates distinct patterns corresponding to the ten subcluster profiles (sc = subcluster number), for which the number of genes each comprises is indicated. Abbreviations: gc = gastric cirri, ov = ovaries, tnt = tentacle (and pedalium base), rhp = rhopalium, and pln = planulae. Gene annotations by subcluster provided in Additional file 8
Fig. 8
Fig. 8
a-k Sex Heatmap for A. alata. Hierarchical clustering (EdgeR) and corresponding ten subcluster profiles for the 104 genes implicated in sex and early development differentially expressed across A. alata medusa (gastric cirri, ovaries, tentacle (and pedalium base), rhopalium) and planulae samples. Intensity of color indicates expression levels for each of the ten hierarchical clusters (vertical access). Bright yellow patches correspond to the highest peaks for each k-mean subcluster profile. K-mean profiles (b-k) match the order of column names in a, representing the mean expression of gene clusters highly abundant in each sample (centroid demarcated by the solid line; zero indicated by the horizontal dashed red line). Two yellow gene clusters in the gastric cirri column correspond to peaks in plot b and c; six bright yellow clusters in the ovaries column corresponds to profiles d-i; no major abundant gene clusters were detected in the tentacle column; four less intense clusters in the rhopalium column correspond to peaks in plots b, d, e, and h; two bright clusters in the planulae column correspond to peaks in the subcluster profiles j and k. The vertical colored bar on the left of the heatmap (a) indicates distinct patterns corresponding to the ten subcluster profiles (sc = subcluster number), for which the number of genes each comprises is indicated. Abbreviations: gc = gastric cirri, ov = ovaries, tnt = tentacle (and pedalium base), rhp = rhopalium, and pln = planulae. Gene annotations by subcluster provided in Additional file 9
Fig. 9
Fig. 9
Cnidarian CaTX/CrTX toxin family gene tree. ML topology of all known homologs of the CaTX/CrTX toxin family in cnidarian taxa from NCBI Genbank and transcriptome components of A. alata in this study. Assumes the WAG + G + F model of amino acid evolution, as specified as most appropriate by ProtTest v. 3.2. Shimodaira-Hasegawa-like branch support indices are shown at each node. Tissue-specific expression patterns correspond to transcripts primarily enriched in the tentacle (in blue) and gastric cirri (in beige). In A. alata, the expression of genes annotated as the CaTX-A homolog is specific to the tentacle (and pedalium base) sample (comp70167, comp71168), while genes annotated as the CrTX-A homolog are specific to gastric cirri and a single tentacle gene (comp76495). Additionally, the expression of a single gene (comp76989) annotated as both CrTX and CaTX is tentacle specific
Fig. 10
Fig. 10
Cnidarian minicollagen gene tree. ML topology of minicollagen gene family in cnidarian taxa from NCBI Genbank and transcriptome components of A. alata in this study. Assumes the BLOSS62I-G-F model of amino acid evolution, as specified as most appropriate by ProtTest v. 3.2. Shimodaira-Hasegawa-like branch support indices are shown at each node. All A. alata minicollagen types were more closely related to non-cubozoan homologs. Following Shpirer et al. 2014, Group 1 minicollagens possess N- and C-terminal cysteine rich domains (CRDs) of a regular form (CXXXCXXXCXXXCXXXCC). We use the label Group 1 (variant) to identify those minicollagens having three or more regular CRDs. Group 2 minicollagens possess one regular and one irregular CRD, with the variant form having the regular CRD at the C-terminus, whereas Group 3 minicollagens possess irregular CRDs at both termini. One (comp76287_c0) of the three recovered minicollagen homologs from A. alata was expressed across all five samples, but most abundant in the tentacle (and pedalium base)
Fig. 11
Fig. 11
Cnidarian opsin gene tree. ML topology of all known homologs of the opsin gene family in cnidarian taxa from NCBI Genbank and transcriptome components of A. alata in this study. Assumes the LG + G model of amino acid evolution, as specified as most appropriate by ProtTest v. 3.2. Shimodaira-Hasegawa-like branch support indices are shown at each node. Blue, pink and brown shading correspond to cnidarian opsin groups A, B and C, respectively, recognized by Feuda et al. (2012). Group A is arbitrarily chosen for rooting the topology; Group B is monophyletic, but Group C cannot be given our derived topology. Stars denote opsin transcripts almost exclusively abundant in the A. alata rhopalium sample (comp54829, comp71410) and ovals denote the same in the planulae sample (comp60054, comp69885, comp74859)
Fig. 12
Fig. 12
Cnidarian Vitellogenin gene tree. ML topology of all known homologs of the Vitellogenin gene superfamily and apolipophorin-like putative Vitellogenin precursor in cnidarian taxa from NCBI Genbank and transcriptome components of A. alata in this study. Assumes the LG + G model of amino acid evolution, as specified as most appropriate by ProtTest v. 3.2. Shimodaira-Hasegawa-like branch support indices are shown at each node. Grey (top) highlights a clade of apolipophorin-like putative Vitellogenin precursor homologs for cubozoan Carukia barnesi and A. alata from this study and hydrozoan Hydra vulgaris, while the non-highlighted clade (bottom) highlights the relationships among known Vitellogenins of cnidarian taxa. Stars designate transcripts most upregulated in the ovaries (comp74784, comp75374 & comp77096); all others are either most highly expressed in the tentacle (comp35113 & 51914) or equally high in the gastric cirri and tentacle samples (comp57678 & comp75135)

References

    1. Lewis C, Long TAF. Courtship and reproduction in Carybdea sivickisi (Cnidaria: Cubozoa). Mar. Biol. [Internet]. 2005 [cited 2014 Feb 27];147:477–83. Available from: http://link.springer.com/10.1007/s00227-005-1602-0 - DOI
    1. Lewis C, Bentlage B, Yanagihara AA, Gillan W, Blerk JVAN, Keil DP, et al. Redescription of Alatina alata (Reynaud, 1830) (Cnidaria: Cubozoa) from Bonaire, Dutch Caribbean. Zootaxa. 2013;3737:473–87. doi: 10.11646/zootaxa.3737.4.8. - DOI - PMC - PubMed
    1. Garm A, Lebouvier M, Tolunay D. Mating in the box jellyfish Copula sivickisi-Novel function of cnidocytes. J. Morphol. [Internet]. 2015 [cited 2015 Jun 4];00. Available from: http://www.ncbi.nlm.nih.gov/pubmed/26010863 - PubMed
    1. Lewis C, Bentlage B. Clarifying the identity of the Japanese Habu-kurage, Chironex yamaguchii, sp. nov. (Cnidaria: Cubozoa: Chirodropida) Zootaxa. 2009;65:59–65.
    1. Brinkman DL, Jia X, Potriquet J, Kumar D, Dash D, Kvaskoff D, et al. Transcriptome and venom proteome of the box jellyfish Chironex fleckeri. BMC Genomics [Internet]. 2015 [cited 2015 Jun 5];16:407. Available from: http://www.biomedcentral.com/1471-2164/16/407 - PMC - PubMed

Publication types

Substances

LinkOut - more resources