

Robust free-breathing SASHA T1 mapping with high-contrast image registration
- PMID: 27535744
- PMCID: PMC4989502
- DOI: 10.1186/s12968-016-0267-9
Robust free-breathing SASHA T1 mapping with high-contrast image registration
Abstract
Background: Many widely used myocardial T1 mapping sequences use breath-hold acquisitions that limit the precision of calculated T1 maps. The SAturation-recovery single-SHot Acquisition (SASHA) sequence has high accuracy with robustness against systematic confounders, but has poorer precision compared to the commonly used MOdified Look-Locker Inversion recovery (MOLLI) sequence. We propose a novel method for generating high-contrast SASHA images to enable a robust image registration approach to free-breathing T1 mapping with high accuracy and precision.
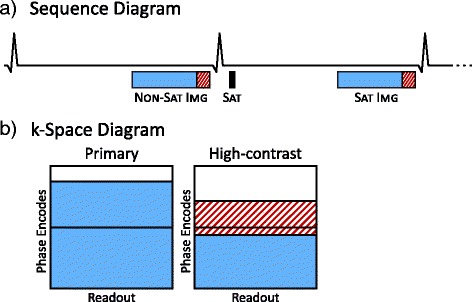
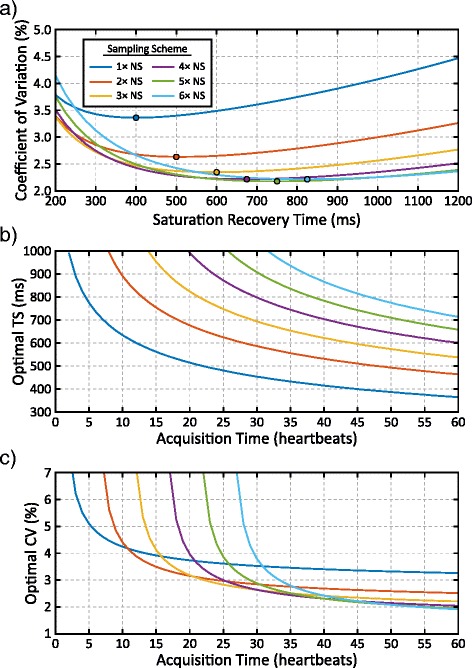
Methods: High-contrast (HC) images were acquired in addition to primary variable flip angle (VFA) SASHA images by collecting an additional 15 k-space lines and sharing k-space data with the primary image. The number of free-breathing images and their saturation recovery times were optimized through numerical simulations. Accuracy and precision of T1 maps using the proposed SASHA-HC sequence was compared in 10 volunteers at 1.5 T to MOLLI, a breath-hold SASHA-VFA sequence, and free-breathing SASHA-VFA data processed using conventional navigator gating and standard image registration. Free-breathing T1 maps from 15 patients and 10 volunteers were graded by blinded observers for sharpness and artifacts.
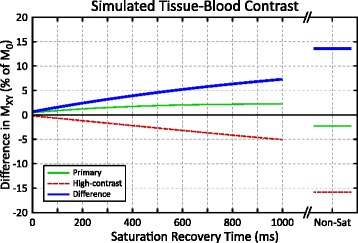
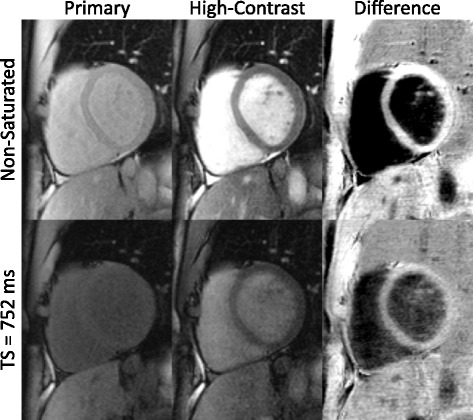
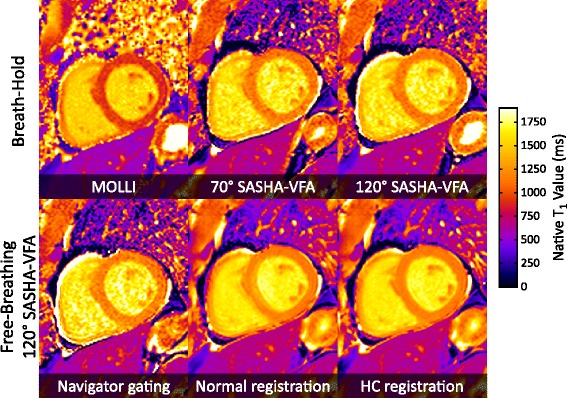
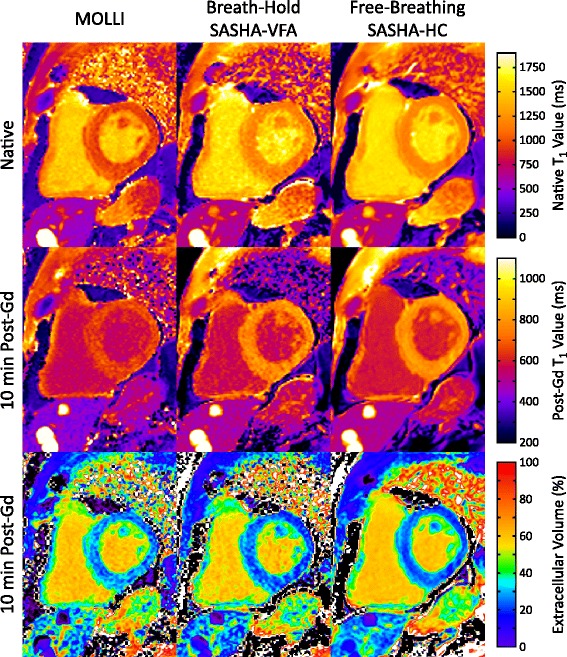
Results: Difference images calculated by subtracting HC and primary SASHA images had greater tissue-blood contrast than the primary images alone, with a 3× improvement for 700 ms TS saturation recovery images and a 6× increase in tissue-blood contrast for non-saturated images. Myocardial T1s calculated in volunteers with free-breathing SASHA-HC were similar to standard breath-hold SASHA-VFA (1156.1 ± 28.1 ms vs 1149.4 ± 26.5 ms, p >0.05). The standard deviation of myocardial T1 values using a 108 s free-breathing SASHA-HC (36.2 ± 3.1 ms) was 50 % lower (p <0.01) than breath-hold SASHA-VFA (72.7 ± 8.0 ms) and 34 % lower (p <0.01) than breath-hold MOLLI (54.7 ± 5.9 ms). T1 map quality scores in volunteers were higher with SASHA-HC (4.7 ± 0.3 out of 5) than navigator gating (3.6 ± 0.4, p <0.01) or normal registration (3.7 ± 0.4, p <0.01). SASHA-HC T1 maps had comparable precision to breath-hold MOLLI using a retrospectively down-sampled 30 s free-breathing acquisition and 30 % higher precision with a 60 s acquisition.
Conclusions: High-contrast SASHA images enable a robust image registration approach to free-breathing T1 mapping. Free-breathing SASHA-HC provides accurate T1 maps with higher precision than MOLLI in acquisitions longer than 30 s.
Keywords: Extracellular volume; Fibrosis; Free-breathing; Image registration; SASHA; T1 mapping.
Figures


Similar articles
-
Myocardial T1-mapping at 3T using saturation-recovery: reference values, precision and comparison with MOLLI.J Cardiovasc Magn Reson. 2016 Nov 18;18(1):84. doi: 10.1186/s12968-016-0302-x. J Cardiovasc Magn Reson. 2016. PMID: 27855705 Free PMC article.
-
3D SASHA myocardial T1 mapping with high accuracy and improved precision.MAGMA. 2019 Apr;32(2):281-289. doi: 10.1007/s10334-018-0703-y. Epub 2018 Sep 6. MAGMA. 2019. PMID: 30191345 Free PMC article.
-
Saturation recovery single-shot acquisition (SASHA) for myocardial T(1) mapping.Magn Reson Med. 2014 Jun;71(6):2082-95. doi: 10.1002/mrm.24878. Epub 2013 Jul 23. Magn Reson Med. 2014. PMID: 23881866
-
Native Myocardial T1 Mapping, Are We There Yet?Int Heart J. 2016 Jul 27;57(4):400-7. doi: 10.1536/ihj.16-169. Epub 2016 Jul 11. Int Heart J. 2016. PMID: 27396560 Review.
-
Myocardial T1 mapping and extracellular volume quantification: an overview of technical and biological confounders.Int J Cardiovasc Imaging. 2018 Jan;34(1):3-14. doi: 10.1007/s10554-017-1235-7. Epub 2017 Aug 28. Int J Cardiovasc Imaging. 2018. PMID: 28849419 Free PMC article. Review.
Cited by
-
Native T1 and Extracellular Volume Measurements by Cardiac MRI in Healthy Adults: A Meta-Analysis.Radiology. 2019 Feb;290(2):317-326. doi: 10.1148/radiol.2018180226. Epub 2018 Nov 13. Radiology. 2019. PMID: 30422092 Free PMC article.
-
Clinical recommendations for cardiovascular magnetic resonance mapping of T1, T2, T2* and extracellular volume: A consensus statement by the Society for Cardiovascular Magnetic Resonance (SCMR) endorsed by the European Association for Cardiovascular Imaging (EACVI).J Cardiovasc Magn Reson. 2017 Oct 9;19(1):75. doi: 10.1186/s12968-017-0389-8. J Cardiovasc Magn Reson. 2017. PMID: 28992817 Free PMC article.
-
Simultaneous multislice imaging for native myocardial T1 mapping: Improved spatial coverage in a single breath-hold.Magn Reson Med. 2017 Aug;78(2):462-471. doi: 10.1002/mrm.26770. Epub 2017 Jun 5. Magn Reson Med. 2017. PMID: 28580583 Free PMC article.
-
Cardiac MR: From Theory to Practice.Front Cardiovasc Med. 2022 Mar 3;9:826283. doi: 10.3389/fcvm.2022.826283. eCollection 2022. Front Cardiovasc Med. 2022. PMID: 35310962 Free PMC article. Review.
-
Pilot tone-based prospective correction of respiratory motion for free-breathing myocardial T1 mapping.MAGMA. 2023 Feb;36(1):135-150. doi: 10.1007/s10334-022-01032-4. Epub 2022 Aug 3. MAGMA. 2023. PMID: 35921020 Free PMC article.
References
Publication types
MeSH terms
Substances
Grants and funding
LinkOut - more resources
Full Text Sources
Other Literature Sources
Medical
