. 2016 Aug 18:7:12416.
doi: 10.1038/ncomms12416.

Neural processes mediating contextual influences on human choice behaviour

Affiliations

Neural processes mediating contextual influences on human choice behaviour

Francesco Rigoli et al. Nat Commun. .

Abstract

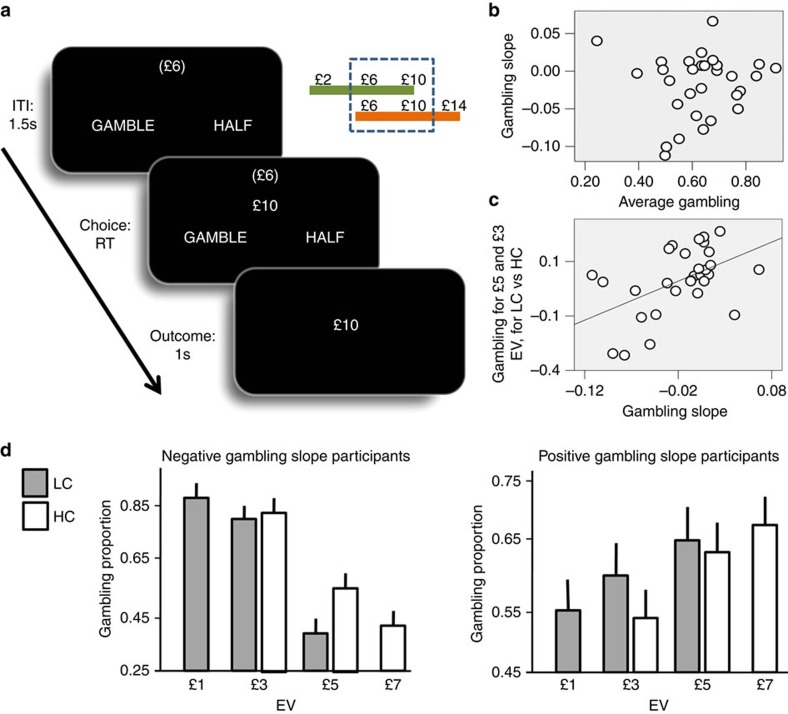
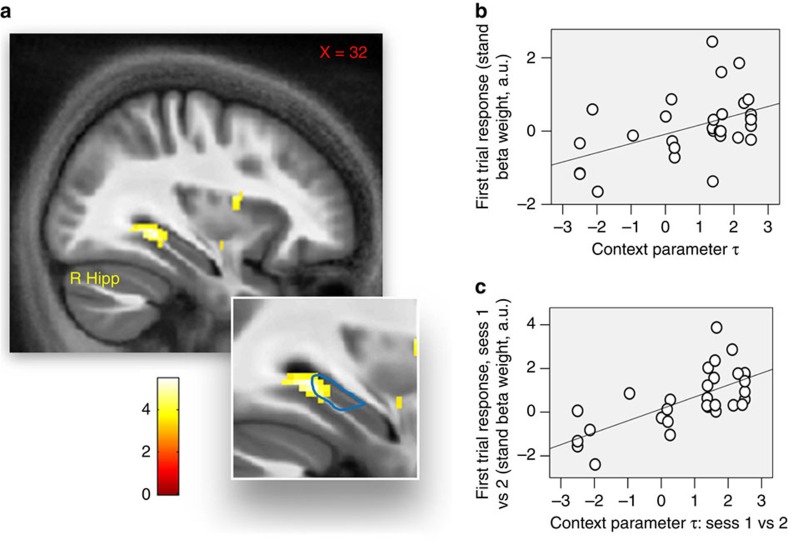
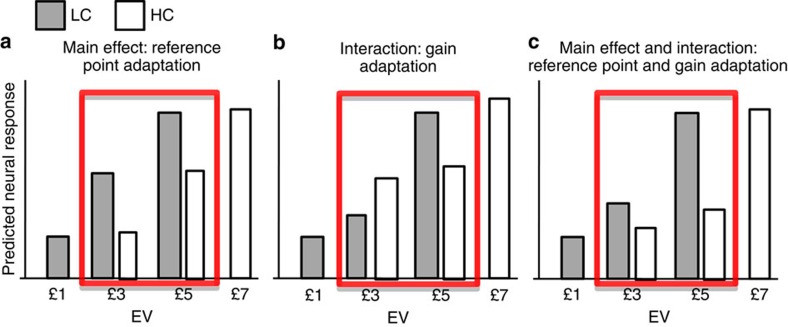
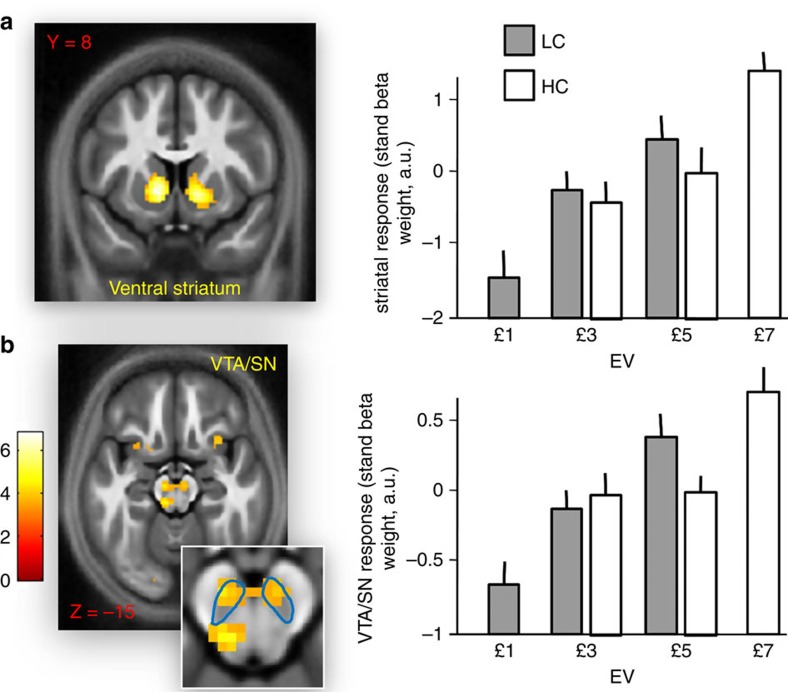
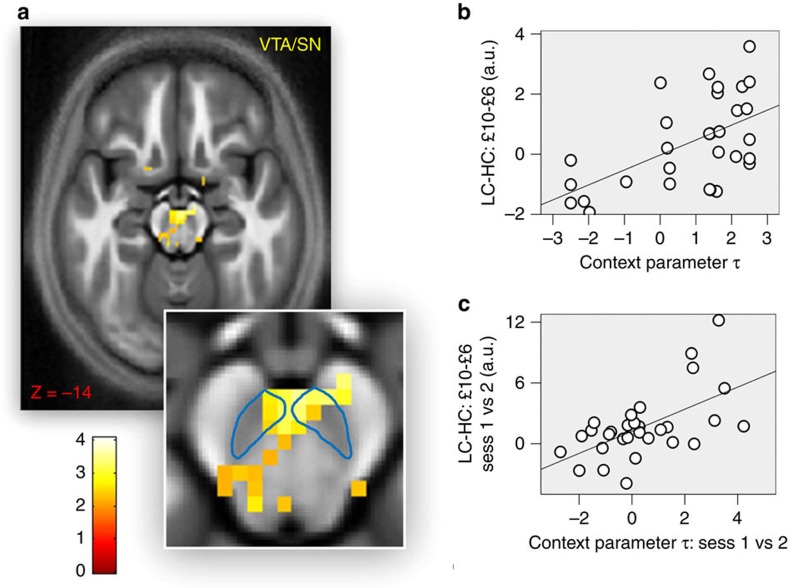
Contextual influences on choice are ubiquitous in ecological settings. Current evidence suggests that subjective values are normalized with respect to the distribution of potentially available rewards. However, how this context-sensitivity is realised in the brain remains unknown. To address this, here we examine functional magnetic resonance imaging (fMRI) data during performance of a gambling task where blocks comprise values drawn from one of two different, but partially overlapping, reward distributions or contexts. At the beginning of each block (when information about context is provided), hippocampus is activated and this response is enhanced when contextual influence on choice increases. In addition, response to value in ventral tegmental area/substantia nigra (VTA/SN) shows context-sensitivity, an effect enhanced with an increased contextual influence on choice. Finally, greater response in hippocampus at block start is associated with enhanced context sensitivity in VTA/SN. These findings suggest that context-sensitive choice is driven by a brain circuit involving hippocampus and dopaminergic midbrain.


Figures

Figure 1
Figure 1. Behavioural results.
(a) Experimental paradigm: on every trial, participants were presented with a monetary gain amount (£10 in the example) in the centre of the screen. They had to choose between receiving half of it (£5 in the example) for sure or select a 50:50 gamble associated with either the full amount or a zero outcome (hence options had always equivalent EV). After an option was selected (by pressing one of two buttons on a keyboard—left for the gambling, right for the safe option), the outcome appeared for 1 s. During a 1.5 s inter-trial interval, a monetary amount was visible on the top of the screen (in brackets) that indicated the average amount of monetary amount associated with the current block. A low-value context was associated with £2, £6 and £10 amount (corresponding to £1, £3 and £5 EV, respectively), and a high-value context to £6, £10 and £14 amount (corresponding to £3, £5 and £7 EV, respectively). Contexts alternated pseudo-randomly every 5 trials. (b) Relationship between individual average gambling proportion (x-axis) and the beta weight (labelled as gambling slope; y-axis) of the logistic regression of choice behaviour with EV as predictor (r(30)=0.06, P=0.74, non significant). (c) Relationship between the gambling slope (x-axis) and the difference in gambling proportion for £3 and £5 choices (common to both contexts) comparing the low-value context (LC) and the high-value context (HC) (y-axis; r(30)=0.5, P=0.005). (d) Gambling proportion plotted separately for participants with negative (n=16; on the left) and positive (n=14; on the right) gambling slope parameter, for different EVs and contexts. Error bars represent standard errors. Considering choices common to both contexts (that is, £3 and £5), it is evident that participants who risked more with decreasing EVs (that is, with a negative gambling slope) gambled more when equivalent choices were smaller compared with the context; whereas participants who risked more with increasing EVs (that is, with a positive gambling slope) gambled more when equivalent choices were larger compared with the context.
Figure 2
Figure 2. Brain response at the first trial of a block.
(a) Brain activation in the right hippocampus (Hipp) at first trials of blocks (32, −37, −12; Z=4.02, P=0.003 SVC). Significance threshold of P<0.005 is used in the figure for display purposes. The faint blue line represents our ROI relative to posterior hippocampus. (b) Relationship between the individual context parameter τ (reporting, for each participant, the degree of contextual adaptation during the task) and the beta weight relative to first trials of blocks in right hippocampus (32, −34, −8; Z=3.19, P=0.038 SVC). Data are plotted for the peak-activation voxel (plot is for display purposes only and no further analyses were performed on these data). (c) Relationship between (i) the difference in the individual context parameter τ, when comparing the first and second session of the task and (ii) the beta weight relative to first trials of blocks in right hippocampus, when comparing the first and second session of the task (32, −29, −7; Z=3.28, P=0.030 SVC). Data are plotted for the peak-activation voxel (plot is for display purposes only and no further analyses were performed on these data).
Figure 3
Figure 3. Predicted neural response at option presentation in the two contexts for different EVs, as postulated by different hypotheses.
(a) According to an hypothesis of a neural reference point which reflects the average contextual EV, a lower reference point is predicted in the low-value context (LC; in grey) compared with the high-value context (HC; in white), leading to larger responses for £3 and £5 EV (highlighted in red) in the former context. Note that the difference in brain activity between £5 and £3 choices is equivalent in the low and high-value context. (b) According to the hypothesis that the neural gain increases in low-value contexts, the difference in activation between £5 and £3 choices is larger in the low compared with high-value context. Note that the overall activity when comparing EVs common to both contexts is not necessarily different, as exemplified here. (c) Several models of non-linear normalization predict in the low-value context both larger response for EVs common to both contexts and increased difference in activity between £5 and £3 when comparing the two contexts. These predictions are shown here.
Figure 4
Figure 4. Brain response to EV at option presentation.
(a) On the left, response in ventral striatum at option presentation for choices associated with £7 EV compared with choices associated with £1 EV (left: −10, 8, −2; Z=5.11, P<0.001 SVC; right: 12, 13, 0; Z=5.21, P<0.001 SVC). Significance threshold of P<0.005 is used in the figure for display purposes. On the right, beta weights (adjusted to each participant's mean) for the choices associated with the different EVs in the low-value context (LC; in grey) and high-value context (HC; in white). Data are shown for the peak-activation voxel from the £7 minus £1 EV contrast. Error lines represent s.e.m. (b) On the left, response in VTA/SN at option presentation for choices associated with £7 EV compared with choices associated with £1 EV (−8, −17, −15; Z=3.80, P=0.005 SVC). The faint blue line represents our ROI relative to VTA/SN. On the right, beta weights (adjusted to each participant's mean) for the choices associated with the different EVs and contexts. Data are shown for the peak-activation voxel from the £7 minus £1 EV contrast.
Figure 5
Figure 5. The impact of context on activity in VTA/SN.
(a) Brain activation at option presentation in VTA/SN for choices associated with £5 EV minus choices associated with £3 EV when comparing low- and high-value context (−3, −24, −22; Z=3.23, P=0.036 SVC). Significance threshold of P<0.005 is used in the figure for display purposes. The faint blue line represents our ROI relative to VTA/SN. (b) Relationship between the individual context parameter τ (reporting, for each participant, the degree of contextual adaptation during the task) and the neural contrast related to choices associated with £5 minus choices associated with £3 when comparing low- and high-value context in VTA/SN (−1, −22, −20; Z=3.22, P=0.037 SVC). Data are plotted for the peak-activation voxel (plot is for display purposes only and no further analyses were performed on these data). (c) Relationship between (i) the difference in the individual context parameter τ when comparing the first and second session of the task and (ii) the contrast related to choices associated with £5 minus choices associated with £3 when comparing low- and high-value context in VTA/SN (2, −22, −15; Z=3.39, P=0.018 SVC). Data are plotted for the peak-activation voxel (plot is for display purposes only and no further analyses were performed on these data).

Similar articles

Cited by

References

    1. Kahneman D. & Tversky A. Prospect theory: an analysis of decision under risk. Econometrica 47, 263–291 (1979).
    1. Louie K., Khaw M. W. & Glimcher P. W. Normalization is a general neural mechanism for context-dependent decision making. Proc. Natl Acad. Sci. 110, 6139–6144 (2013). - PMC - PubMed
    1. Ludvig E. A., Madan C. R. & Spetch M. L. Extreme outcomes sway risky decisions from experience. J. Behav. Decis. Making 27, 146–156 (2013).
    1. Stewart N., Chater N., Stott H. P. & Reimers S. Prospect relativity: how choice options influence decision under risk. J. Exp. Psychol. Gen. 132, 23–46 (2003). - PubMed
    1. Stewart N., Chater N. & Brown G. D. Decision by sampling. Cognit. Psychol. 53, 1–26 (2006). - PubMed

Publication types

LinkOut - more resources