

Arterial CO2 Fluctuations Modulate Neuronal Rhythmicity: Implications for MEG and fMRI Studies of Resting-State Networks
- PMID: 27535903
- PMCID: PMC4987431
- DOI: 10.1523/JNEUROSCI.4263-15.2016
Arterial CO2 Fluctuations Modulate Neuronal Rhythmicity: Implications for MEG and fMRI Studies of Resting-State Networks
Abstract
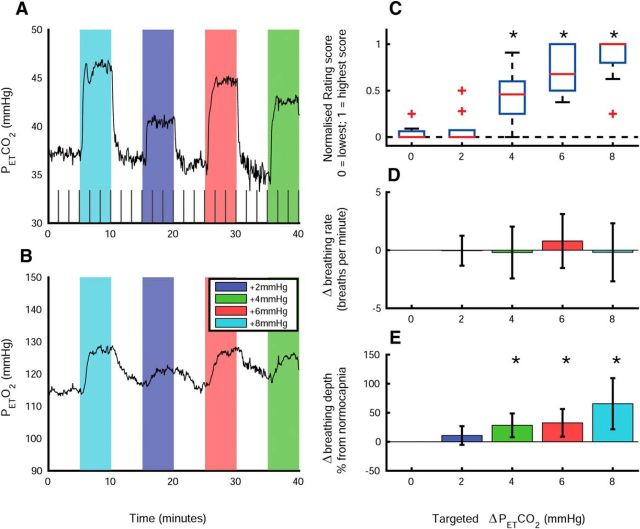
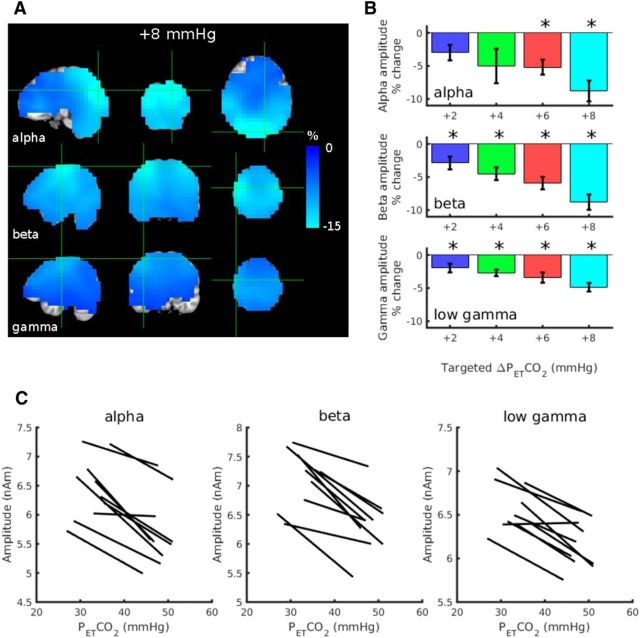
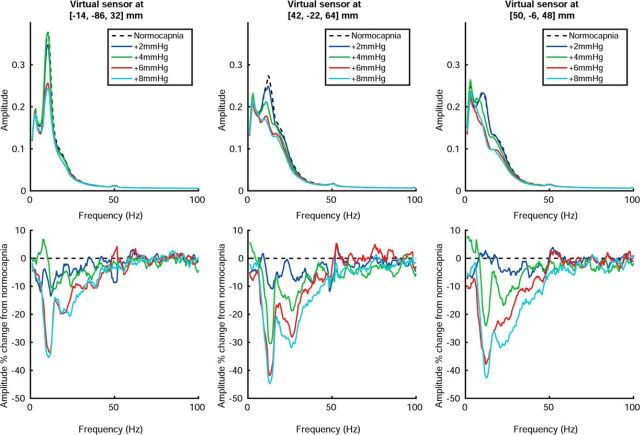
A fast emerging technique for studying human resting state networks (RSNs) is based on spontaneous temporal fluctuations in neuronal oscillatory power, as measured by magnetoencephalography. However, it has been demonstrated recently that this power is sensitive to modulations in arterial CO2 concentration. Arterial CO2 can be modulated by natural fluctuations in breathing pattern, as might typically occur during the acquisition of an RSN experiment. Here, we demonstrate for the first time the fine-scale dependence of neuronal oscillatory power on arterial CO2 concentration, showing that reductions in alpha, beta, and gamma power are observed with even very mild levels of hypercapnia (increased arterial CO2). We use a graded hypercapnia paradigm and participant feedback to rule out a sensory cause, suggesting a predominantly physiological origin. Furthermore, we demonstrate that natural fluctuations in arterial CO2, without administration of inspired CO2, are of a sufficient level to influence neuronal oscillatory power significantly in the delta-, alpha-, beta-, and gamma-frequency bands. A more thorough understanding of the relationship between physiological factors and cortical rhythmicity is required. In light of these findings, existing results, paradigms, and analysis techniques for the study of resting-state brain data should be revisited.
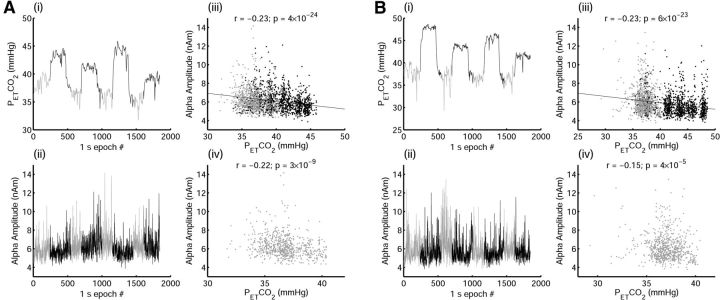
Significance statement: In this study, we show for the first time that neuronal oscillatory power is intimately linked to arterial CO2 concentration down to the fine-scale modulations that occur during spontaneous breathing. We extend these results to demonstrate a correlation between neuronal oscillatory power and spontaneous arterial CO2 fluctuations in awake humans at rest. This work identifies a need for studies investigating resting-state networks in the human brain to measure and account for the impact of spontaneous changes in arterial CO2 on the neuronal signals of interest. Changes in breathing pattern that are time locked to task performance could also lead to confounding effects on neuronal oscillatory power when considering the electrophysiological response to functional stimulation.
Keywords: cortical oscillations; functional connectivity; hypercapnia; magnetoencephalography; physiological noise.
Copyright © 2016 Driver et al.
Conflict of interest statement
The authors declare no competing financial interests.
Figures

Similar articles
-
The effect of hypercapnia on resting and stimulus induced MEG signals.Neuroimage. 2011 Oct 15;58(4):1034-43. doi: 10.1016/j.neuroimage.2011.06.073. Epub 2011 Jul 7. Neuroimage. 2011. PMID: 21762783
-
Deriving frequency-dependent spatial patterns in MEG-derived resting state sensorimotor network: A novel multiband ICA technique.Hum Brain Mapp. 2017 Feb;38(2):779-791. doi: 10.1002/hbm.23417. Epub 2016 Oct 22. Hum Brain Mapp. 2017. PMID: 27770478 Free PMC article.
-
Broadband Electrophysiological Dynamics Contribute to Global Resting-State fMRI Signal.J Neurosci. 2016 Jun 1;36(22):6030-40. doi: 10.1523/JNEUROSCI.0187-16.2016. J Neurosci. 2016. PMID: 27251624 Free PMC article.
-
Mapping cognitive and emotional networks in neurosurgical patients using resting-state functional magnetic resonance imaging.Neurosurg Focus. 2020 Feb 1;48(2):E9. doi: 10.3171/2019.11.FOCUS19773. Neurosurg Focus. 2020. PMID: 32006946 Free PMC article. Review.
-
The relationship between MEG and fMRI.Neuroimage. 2014 Nov 15;102 Pt 1:80-91. doi: 10.1016/j.neuroimage.2013.11.005. Epub 2013 Nov 15. Neuroimage. 2014. PMID: 24239589 Review.
Cited by
-
Depression Classification Using Frequent Subgraph Mining Based on Pattern Growth of Frequent Edge in Functional Magnetic Resonance Imaging Uncertain Network.Front Neurosci. 2022 Apr 29;16:889105. doi: 10.3389/fnins.2022.889105. eCollection 2022. Front Neurosci. 2022. PMID: 35578623 Free PMC article.
-
Cerebrovascular reactivity (CVR) MRI with CO2 challenge: A technical review.Neuroimage. 2019 Feb 15;187:104-115. doi: 10.1016/j.neuroimage.2018.03.047. Epub 2018 Mar 21. Neuroimage. 2019. PMID: 29574034 Free PMC article. Review.
-
Keeping the Breath in Mind: Respiration, Neural Oscillations, and the Free Energy Principle.Front Neurosci. 2021 Jun 29;15:647579. doi: 10.3389/fnins.2021.647579. eCollection 2021. Front Neurosci. 2021. PMID: 34267621 Free PMC article. Review.
-
Potentiation of motor sub-networks for motor control but not working memory: Interaction of dACC and SMA revealed by resting-state directed functional connectivity.PLoS One. 2017 Mar 9;12(3):e0172531. doi: 10.1371/journal.pone.0172531. eCollection 2017. PLoS One. 2017. PMID: 28278267 Free PMC article.
-
Respiratory modulation of beta corticomuscular coherence in isometric hand movements.Cogn Neurodyn. 2025 Dec;19(1):54. doi: 10.1007/s11571-025-10245-x. Epub 2025 Mar 22. Cogn Neurodyn. 2025. PMID: 40129876
References
-
- Banzett RB, Garcia RT, Moosavi SH. Simple contrivance “clamps” end-tidal PCO(2) and PO(2) despite rapid changes in ventilation. J Appl Physiol. 2000;88:1597–1600. - PubMed
Publication types
MeSH terms
Substances
Grants and funding
LinkOut - more resources
Full Text Sources
Other Literature Sources
Medical