

Variant U1 snRNAs are implicated in human pluripotent stem cell maintenance and neuromuscular disease
- PMID: 27536002
- PMCID: PMC5159530
- DOI: 10.1093/nar/gkw711
Variant U1 snRNAs are implicated in human pluripotent stem cell maintenance and neuromuscular disease
Abstract
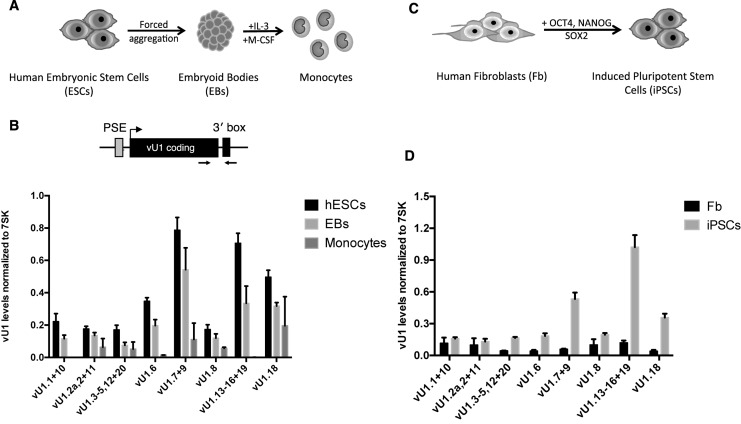
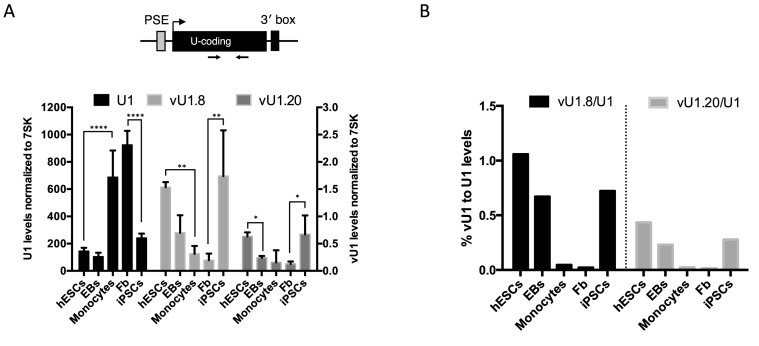
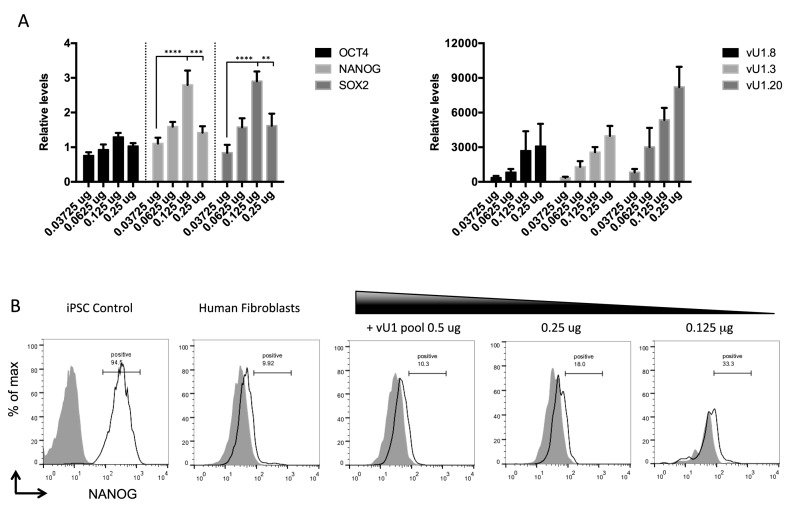
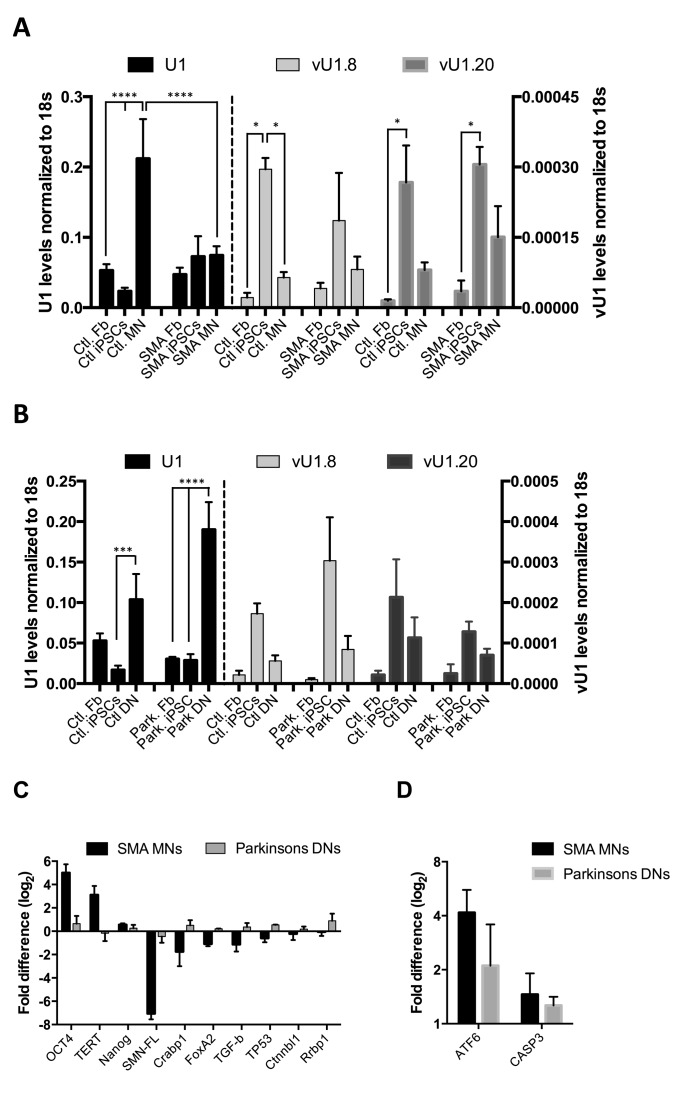
The U1 small nuclear (sn)RNA (U1) is a multifunctional ncRNA, known for its pivotal role in pre-mRNA splicing and regulation of RNA 3' end processing events. We recently demonstrated that a new class of human U1-like snRNAs, the variant (v)U1 snRNAs (vU1s), also participate in pre-mRNA processing events. In this study, we show that several human vU1 genes are specifically upregulated in stem cells and participate in the regulation of cell fate decisions. Significantly, ectopic expression of vU1 genes in human skin fibroblasts leads to increases in levels of key pluripotent stem cell mRNA markers, including NANOG and SOX2. These results reveal an important role for vU1s in the control of key regulatory networks orchestrating the transitions between stem cell maintenance and differentiation. Moreover, vU1 expression varies inversely with U1 expression during differentiation and cell re-programming and this pattern of expression is specifically de-regulated in iPSC-derived motor neurons from Spinal Muscular Atrophy (SMA) type 1 patient's. Accordingly, we suggest that an imbalance in the vU1/U1 ratio, rather than an overall reduction in Uridyl-rich (U)-snRNAs, may contribute to the specific neuromuscular disease phenotype associated with SMA.
© The Author(s) 2016. Published by Oxford University Press on behalf of Nucleic Acids Research.
Figures
Similar articles
-
Examining the capacity of human U1 snRNA variants to facilitate pre-mRNA splicing.RNA. 2024 Feb 16;30(3):271-280. doi: 10.1261/rna.079892.123. RNA. 2024. PMID: 38164604 Free PMC article.
-
Differentially expressed, variant U1 snRNAs regulate gene expression in human cells.Genome Res. 2013 Feb;23(2):281-91. doi: 10.1101/gr.142968.112. Epub 2012 Oct 15. Genome Res. 2013. PMID: 23070852 Free PMC article.
-
Spinal muscular atrophy phenotype is ameliorated in human motor neurons by SMN increase via different novel RNA therapeutic approaches.Sci Rep. 2015 Jun 30;5:11746. doi: 10.1038/srep11746. Sci Rep. 2015. PMID: 26123042 Free PMC article.
-
Development of Engineered-U1 snRNA Therapies: Current Status.Int J Mol Sci. 2023 Sep 27;24(19):14617. doi: 10.3390/ijms241914617. Int J Mol Sci. 2023. PMID: 37834063 Free PMC article. Review.
-
[The role of the U1 snRNP complex in the regulation of gene expression: recent reports].Postepy Biochem. 2024 Sep 17;70(3):348-357. doi: 10.18388/pb.2021_566. Print 2024 Sep 30. Postepy Biochem. 2024. PMID: 39365565 Review. Polish.
Cited by
-
Human spliceosomal snRNA sequence variants generate variant spliceosomes.RNA. 2021 Oct;27(10):1186-1203. doi: 10.1261/rna.078768.121. Epub 2021 Jul 7. RNA. 2021. PMID: 34234030 Free PMC article.
-
Examining the capacity of human U1 snRNA variants to facilitate pre-mRNA splicing.RNA. 2024 Feb 16;30(3):271-280. doi: 10.1261/rna.079892.123. RNA. 2024. PMID: 38164604 Free PMC article.
-
The Integrator complex: an emerging complex structure involved in the regulation of gene expression by targeting RNA polymerase II.Funct Integr Genomics. 2024 Oct 19;24(6):192. doi: 10.1007/s10142-024-01479-9. Funct Integr Genomics. 2024. PMID: 39424688 Review.
-
Brain gliomas new transcriptomic discoveries from differentially expressed genes to therapeutic targets.Sci Rep. 2025 Jan 20;15(1):2553. doi: 10.1038/s41598-025-86316-0. Sci Rep. 2025. PMID: 39833228 Free PMC article.
-
Spinal Muscular Atrophy Modeling and Treatment Advances by Induced Pluripotent Stem Cells Studies.Stem Cell Rev Rep. 2019 Dec;15(6):795-813. doi: 10.1007/s12015-019-09910-6. Stem Cell Rev Rep. 2019. PMID: 31863335 Review.
References
-
- Cech T.R., Steitz J.A. The noncoding RNA revolution-trashing old rules to forge new ones. Cell. 2014;157:77–94. - PubMed
-
- Guiro J., O'Reilly D. Insights into the U1 small nuclear ribonucleoprotein complex superfamily. Wiley Interdiscip. Rev. RNA. 2015;6:79–92. - PubMed
-
- West S. The increasing functional repertoire of U1 snRNA. Biochem. Soc. Trans. 2012;40:846–849. - PubMed
Publication types
MeSH terms
Substances
Grants and funding
LinkOut - more resources
Full Text Sources
Other Literature Sources
Research Materials
