

Phase-Amplitude Coupling Is Elevated in Deep Sleep and in the Onset Zone of Focal Epileptic Seizures
- PMID: 27536227
- PMCID: PMC4971106
- DOI: 10.3389/fnhum.2016.00387
Phase-Amplitude Coupling Is Elevated in Deep Sleep and in the Onset Zone of Focal Epileptic Seizures
Abstract
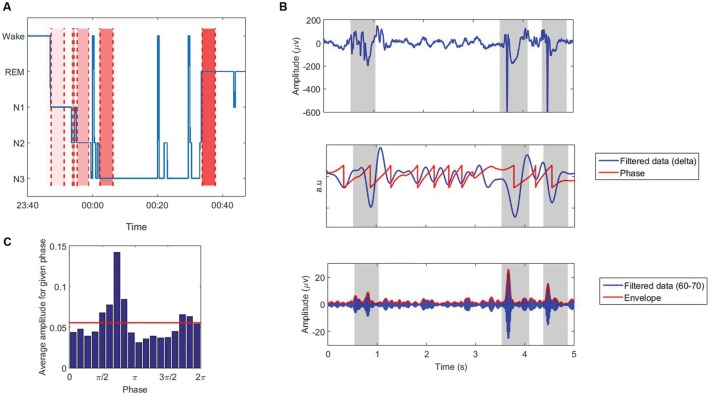
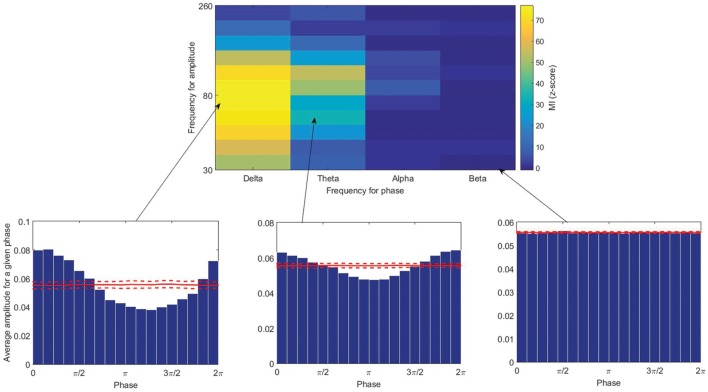
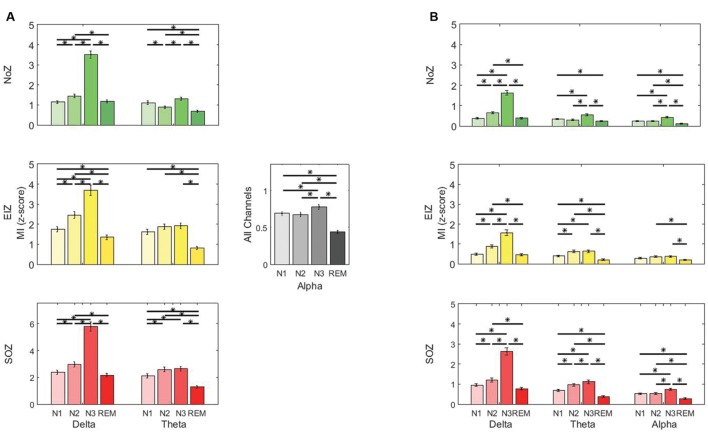
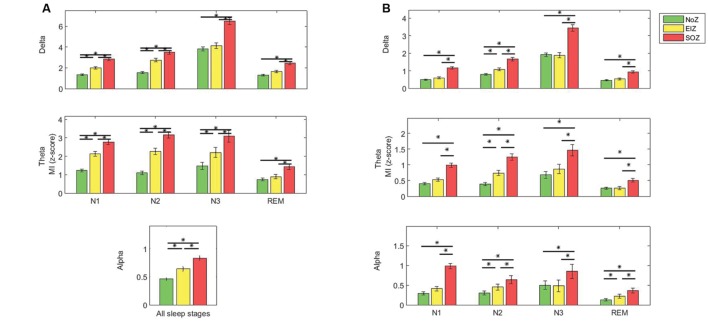
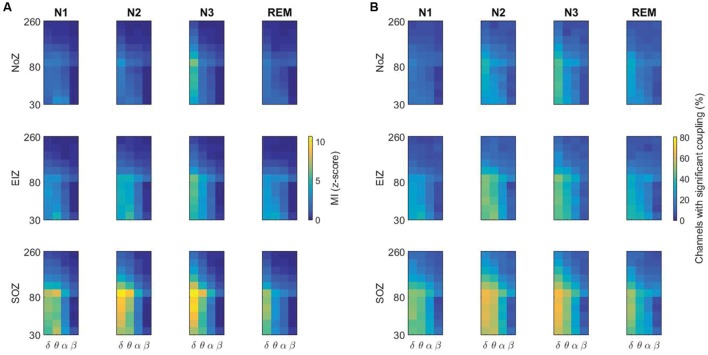
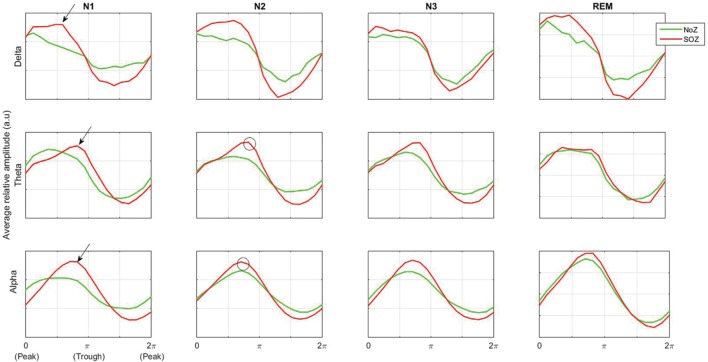
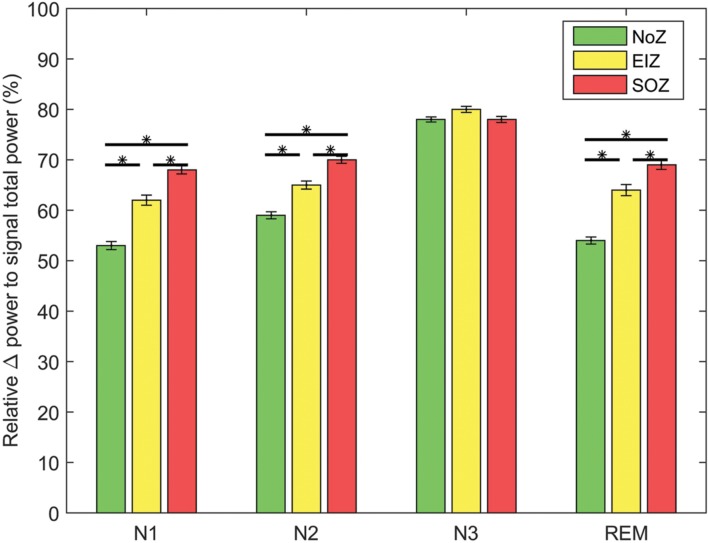
The interactions between different EEG frequency bands have been widely investigated in normal and pathologic brain activity. Phase-amplitude coupling (PAC) is one of the important forms of this interaction where the amplitude of higher frequency oscillations is modulated by the phase of lower frequency activity. Here, we studied the dynamic variations of PAC of high (gamma and ripple) and low (delta, theta, alpha, and beta) frequency bands in patients with focal epilepsy in different sleep stages during the interictal period, in an attempt to see if coupling is different in more or less epileptogenic regions. Sharp activities were excluded to avoid their effect on the PAC. The results revealed that the coupling intensity was generally the highest in stage N3 of sleep and the lowest in rapid eye movement sleep. We also compared the coupling strength in different regions [seizure onset zone (SOZ), exclusively irritative zone, and normal zone]. PAC between high and low frequency rhythms was found to be significantly stronger in the SOZ compared to normal regions. Also, the coupling was generally more elevated in spiking channels outside the SOZ than in normal regions. We also examined how the power in the delta band correlates to the PAC, and found a mild but statistically significant correlation between slower background activity in epileptic channels and the elevated coupling in these channels. The results suggest that an elevated PAC may reflect some fundamental abnormality, even after exclusion of sharp activities and even in the interictal period. PAC may therefore contribute to understanding the underlying dynamics of epileptogenic brain regions.
Keywords: cross-frequency coupling; epilepsy; interictal EEG; phase- amplitude coupling; seizure onset zone; sleep.
Figures
Similar articles
-
Interictal coupling of HFOs and slow oscillations predicts the seizure-onset pattern in mesiotemporal lobe epilepsy.Epilepsia. 2019 Jun;60(6):1160-1170. doi: 10.1111/epi.15541. Epub 2019 May 14. Epilepsia. 2019. PMID: 31087662
-
Phase-Amplitude Coupling Localizes Pathologic Brain with Aid of Behavioral Staging in Sleep.Life (Basel). 2023 May 15;13(5):1186. doi: 10.3390/life13051186. Life (Basel). 2023. PMID: 37240831 Free PMC article.
-
Phase-amplitude coupling of ripple activities during seizure evolution with theta phase.Clin Neurophysiol. 2021 Jun;132(6):1243-1253. doi: 10.1016/j.clinph.2021.03.007. Epub 2021 Mar 26. Clin Neurophysiol. 2021. PMID: 33867253
-
Seizures and Sleep.In: Noebels JL, Avoli M, Rogawski MA, Vezzani A, Delgado-Escueta AV, editors. Jasper's Basic Mechanisms of the Epilepsies. 5th edition. New York: Oxford University Press; 2024. Chapter 14. In: Noebels JL, Avoli M, Rogawski MA, Vezzani A, Delgado-Escueta AV, editors. Jasper's Basic Mechanisms of the Epilepsies. 5th edition. New York: Oxford University Press; 2024. Chapter 14. PMID: 39637155 Free Books & Documents. Review.
-
Focal epilepsies and focal disorders.Handb Clin Neurol. 2019;161:17-43. doi: 10.1016/B978-0-444-64142-7.00039-4. Handb Clin Neurol. 2019. PMID: 31307599 Review.
Cited by
-
Intrinsic and secondary epileptogenicity in focal cortical dysplasia type II.Epilepsia. 2023 Feb;64(2):348-363. doi: 10.1111/epi.17495. Epub 2022 Dec 27. Epilepsia. 2023. PMID: 36527426 Free PMC article.
-
Assessing Epileptogenicity Using Phase-Locked High Frequency Oscillations: A Systematic Comparison of Methods.Front Neurol. 2019 Oct 23;10:1132. doi: 10.3389/fneur.2019.01132. eCollection 2019. Front Neurol. 2019. PMID: 31749757 Free PMC article.
-
Epileptic seizures detection and the analysis of optimal seizure prediction horizon based on frequency and phase analysis.Front Neurosci. 2023 May 16;17:1191683. doi: 10.3389/fnins.2023.1191683. eCollection 2023. Front Neurosci. 2023. PMID: 37260846 Free PMC article.
-
Classifying epileptic phase-amplitude coupling in SEEG using complex-valued convolutional neural network.Front Physiol. 2023 Jan 5;13:1085530. doi: 10.3389/fphys.2022.1085530. eCollection 2022. Front Physiol. 2023. PMID: 36685186 Free PMC article.
-
Integrating artificial intelligence with real-time intracranial EEG monitoring to automate interictal identification of seizure onset zones in focal epilepsy.J Neural Eng. 2018 Aug;15(4):046035. doi: 10.1088/1741-2552/aac960. Epub 2018 Jun 1. J Neural Eng. 2018. PMID: 29855436 Free PMC article.
References
LinkOut - more resources
Full Text Sources
Other Literature Sources