

Vanadate Impedes Adipogenesis in Mesenchymal Stem Cells Derived from Different Depots within Bone
- PMID: 27536268
- PMCID: PMC4971437
- DOI: 10.3389/fendo.2016.00108
Vanadate Impedes Adipogenesis in Mesenchymal Stem Cells Derived from Different Depots within Bone
Abstract
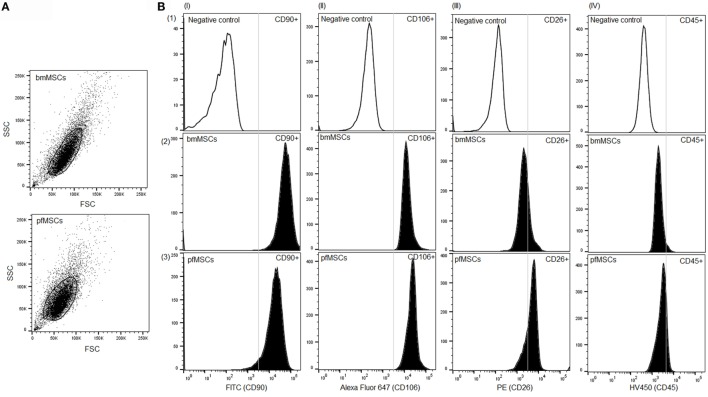
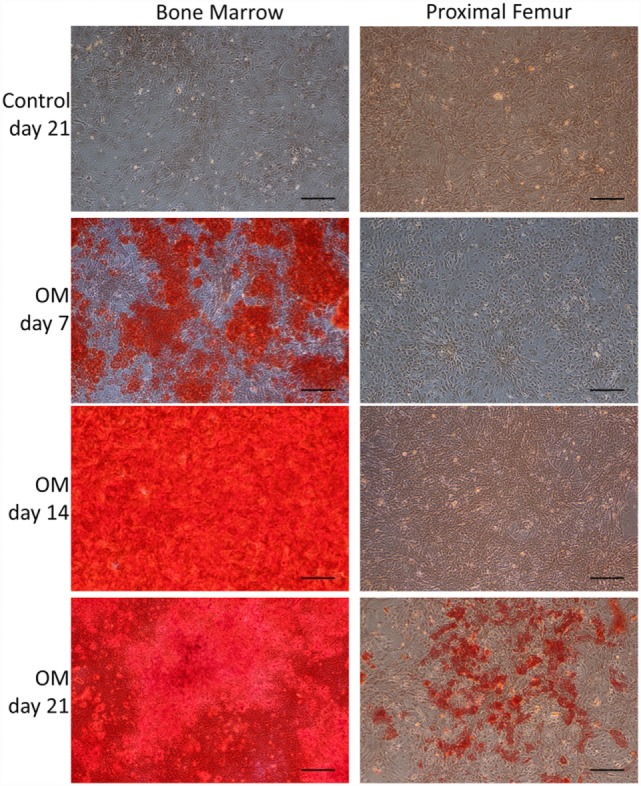
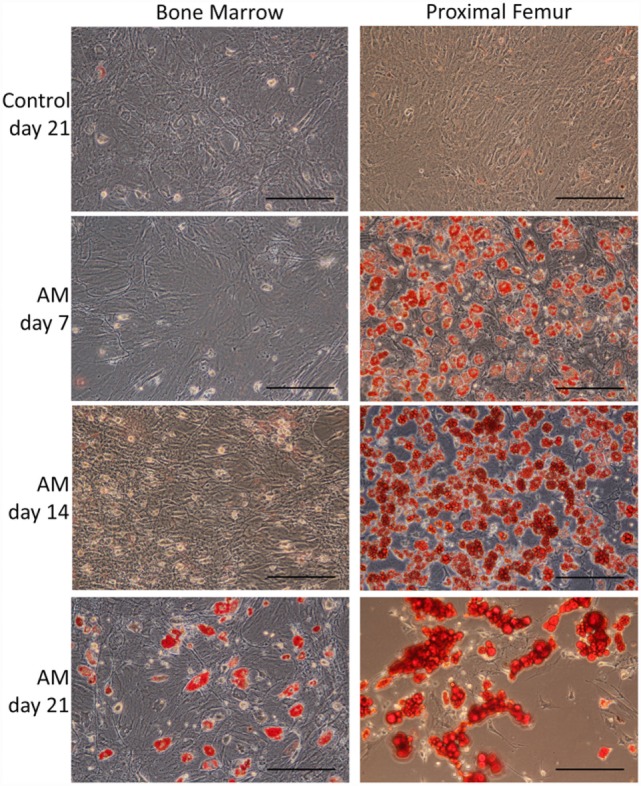
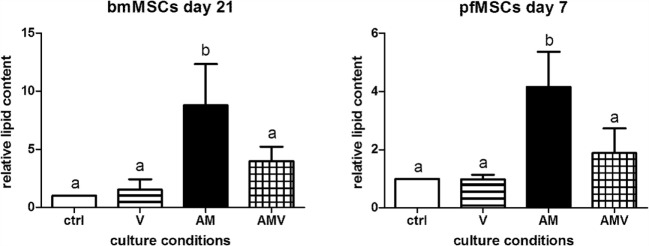
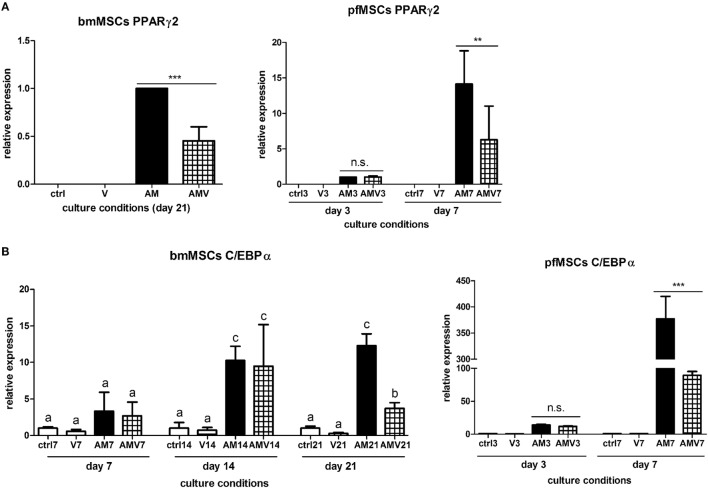
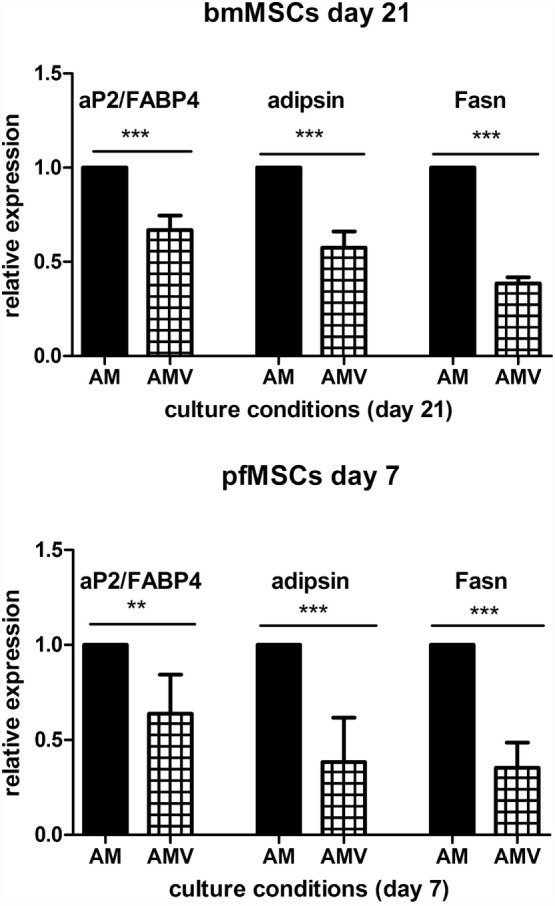
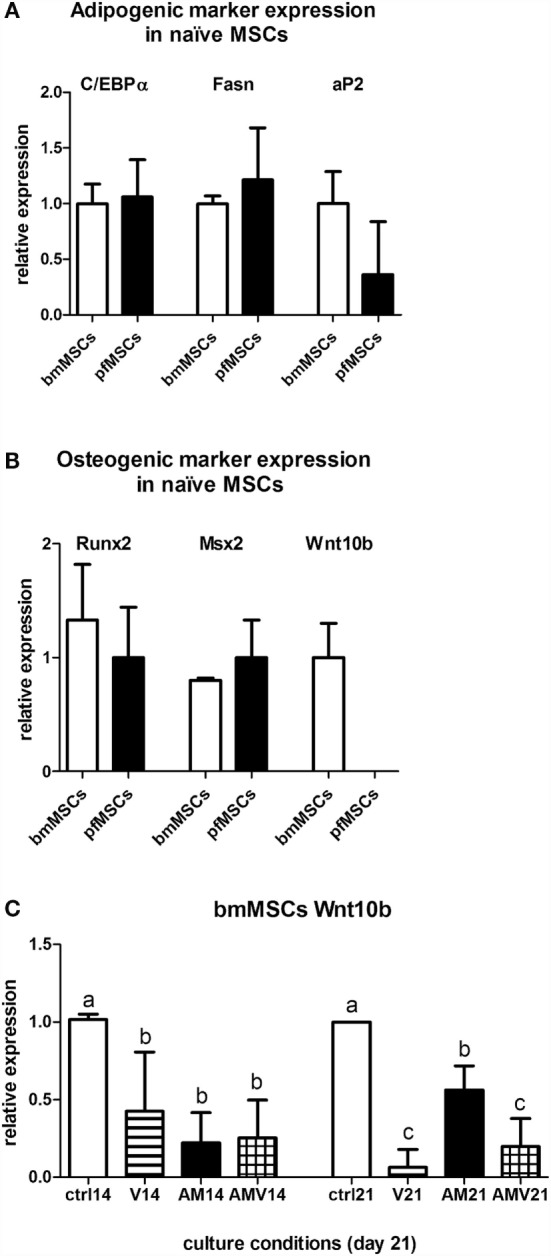
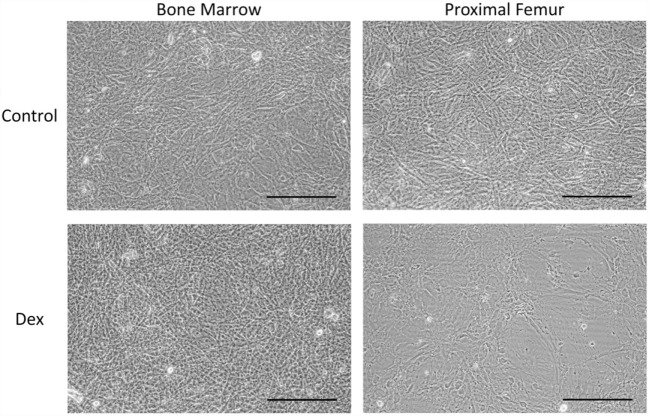
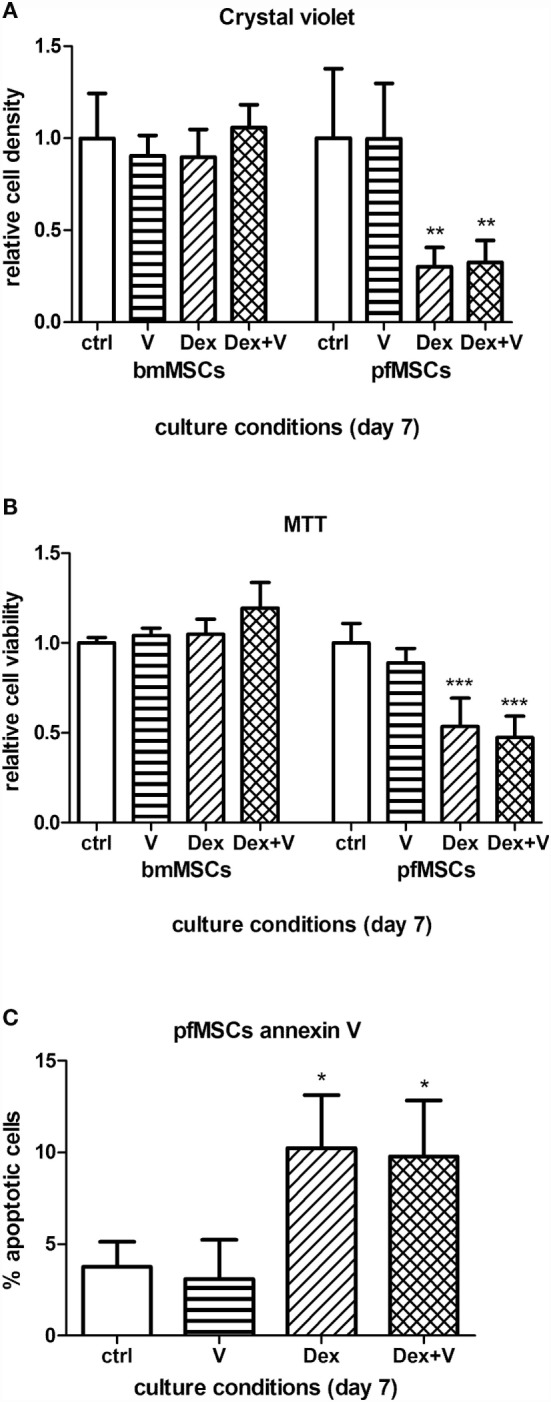
Glucocorticoid-induced osteoporosis (GIO) is associated with an increase in bone marrow adiposity, which skews the differentiation of mesenchymal stem cell (MSC) progenitors away from osteoblastogenesis and toward adipogenesis. We have previously found that vanadate, a non-specific protein tyrosine phosphatase inhibitor, prevents GIO in rats, but it was unclear whether vanadate directly influenced adipogenesis in bone-derived MSCs. For the present study, we investigated the effect of vanadate on adipogenesis in primary rat MSCs derived from bone marrow (bmMSCs) and from the proximal end of the femur (pfMSCs). By passage 3 after isolation, both cell populations expressed the MSC cell surface markers CD90 and CD106, but not the hematopoietic marker CD45. However, although variable, expression of the fibroblast marker CD26 was higher in pfMSCs than in bmMSCs. Differentiation studies using osteogenic and adipogenic induction media (OM and AM, respectively) demonstrated that pfMSCs rapidly accumulated lipid droplets within 1 week of exposure to AM, while bmMSCs isolated from the same femur only formed lipid droplets after 3 weeks of AM treatment. Conversely, pfMSCs exposed to OM produced mineralized extracellular matrix (ECM) after 3 weeks, compared to 1 week for OM-treated bmMSCs. Vanadate (10 μM) added to AM resulted in a significant reduction in AM-induced intracellular lipid accumulation and expression of adipogenic gene markers (PPARγ2, aP2, adipsin) in both pfMSCs and bmMSCs. Pharmacological concentrations of glucocorticoids (1 μM) alone did not induce lipid accumulation in either bmMSCs or pfMSCs, but resulted in significant cell death in pfMSCs. Our findings demonstrate the existence of at least two fundamentally different MSC depots within the femur and highlights the presence of MSCs capable of rapid adipogenesis within the proximal femur, an area prone to osteoporotic fractures. In addition, our results suggest that the increased bone marrow adiposity observed in GIO may not be solely due to direct effect of glucocorticoids on bone-derived MSCs, and that an increase in femur lipid content may also arise from increased adipogenesis in MSCs residing outside of the bone marrow niche.
Keywords: adipogenesis; bone; glucocorticoids; mesenchymal stem cells; vanadate.
Figures
Similar articles
-
Allogeneic Mesenchymal Stem Cell Therapy Promotes Osteoblastogenesis and Prevents Glucocorticoid-Induced Osteoporosis.Stem Cells Transl Med. 2016 Sep;5(9):1238-46. doi: 10.5966/sctm.2015-0347. Epub 2016 Jun 30. Stem Cells Transl Med. 2016. PMID: 27365487 Free PMC article.
-
Lithium chloride attenuates the abnormal osteogenic/adipogenic differentiation of bone marrow-derived mesenchymal stem cells obtained from rats with steroid-related osteonecrosis by activating the β-catenin pathway.Int J Mol Med. 2015 Nov;36(5):1264-72. doi: 10.3892/ijmm.2015.2340. Epub 2015 Sep 8. Int J Mol Med. 2015. PMID: 26352537 Free PMC article.
-
Effects of hindlimb unloading on ex vivo growth and osteogenic/adipogenic potentials of bone marrow-derived mesenchymal stem cells in rats.Stem Cells Dev. 2008 Aug;17(4):795-804. doi: 10.1089/scd.2007.0254. Stem Cells Dev. 2008. PMID: 18710346
-
Involvement of adipogenic potential of human bone marrow mesenchymal stem cells (MSCs) in osteoporosis.Curr Stem Cell Res Ther. 2008 Sep;3(3):208-18. doi: 10.2174/157488808785740325. Curr Stem Cell Res Ther. 2008. PMID: 18782003 Review.
-
Cell Fate and Differentiation of Bone Marrow Mesenchymal Stem Cells.Stem Cells Int. 2016;2016:3753581. doi: 10.1155/2016/3753581. Epub 2016 May 19. Stem Cells Int. 2016. PMID: 27298623 Free PMC article. Review.
Cited by
-
The Regulation of Marrow Fat by Vitamin D: Molecular Mechanisms and Clinical Implications.Curr Osteoporos Rep. 2019 Dec;17(6):405-415. doi: 10.1007/s11914-019-00546-6. Curr Osteoporos Rep. 2019. PMID: 31749086 Review.
-
Osteogenic differentiation of human mesenchymal stromal cells and fibroblasts differs depending on tissue origin and replicative senescence.Sci Rep. 2021 Jun 7;11(1):11968. doi: 10.1038/s41598-021-91501-y. Sci Rep. 2021. PMID: 34099837 Free PMC article.
-
The Effect of Vancomycin on the Viability and Osteogenic Potential of Bone-Derived Mesenchymal Stem Cells.Probiotics Antimicrob Proteins. 2019 Sep;11(3):1009-1014. doi: 10.1007/s12602-018-9473-0. Probiotics Antimicrob Proteins. 2019. PMID: 30276719
-
The Implications of Bone Marrow Adipose Tissue on Inflammaging.Front Endocrinol (Lausanne). 2022 Mar 11;13:853765. doi: 10.3389/fendo.2022.853765. eCollection 2022. Front Endocrinol (Lausanne). 2022. PMID: 35360075 Free PMC article. Review.
-
Systemic Factors During Metabolic Disease Progression Contribute to the Functional Decline of Adipose Tissue-Derived Mesenchymal Stem Cells in Reproductive Aged Females.Front Physiol. 2018 Dec 18;9:1812. doi: 10.3389/fphys.2018.01812. eCollection 2018. Front Physiol. 2018. PMID: 30631282 Free PMC article.
References
LinkOut - more resources
Full Text Sources
Other Literature Sources
Research Materials
Miscellaneous