Review
. 2016 Aug 3:6:177.
doi: 10.3389/fonc.2016.00177. eCollection 2016.

Monitoring of Hadrontherapy Treatments by Means of Charged Particle Detection

Affiliations
Review

Monitoring of Hadrontherapy Treatments by Means of Charged Particle Detection

Silvia Muraro et al. Front Oncol. .

Abstract

The interaction of the incoming beam radiation with the patient body in hadrontherapy treatments produces secondary charged and neutral particles, whose detection can be used for monitoring purposes and to perform an on-line check of beam particle range. In the context of ion-therapy with active scanning, charged particles are potentially attractive since they can be easily tracked with a high efficiency, in presence of a relatively low background contamination. In order to verify the possibility of exploiting this approach for in-beam monitoring in ion-therapy, and to guide the design of specific detectors, both simulations and experimental tests are being performed with ion beams impinging on simple homogeneous tissue-like targets (PMMA). From these studies, a resolution of the order of few millimeters on the single track has been proven to be sufficient to exploit charged particle tracking for monitoring purposes, preserving the precision achievable on longitudinal shape. The results obtained so far show that the measurement of charged particles can be successfully implemented in a technology capable of monitoring both the dose profile and the position of the Bragg peak inside the target and finally lead to the design of a novel profile detector. Crucial aspects to be considered are the detector positioning, to be optimized in order to maximize the available statistics, and the capability of accounting for the multiple scattering interactions undergone by the charged fragments along their exit path from the patient body. The experimental results collected up to now are also valuable for the validation of Monte Carlo simulation software tools and their implementation in Treatment Planning Software packages.

Keywords: hadrontherapy; particle detection; real time monitoring.


Figures

Figure 1
Figure 1
Distribution of the track back-projections for 5 × 104 measured secondary charged particles produced by the interaction of a carbon beam with a PMMA phantom at the HIT facility (26). The dimensions of the cylindrical PMMA phantom are illustrated by the black rectangle (view from the side). The origin of the coordinate system is aligned with the center of the phantom that was placed in the isocentre. The carbon ion beam was directed along the Z-axis. The depth dose distribution measured in water and scaled to the phantom water equivalent path length (WEPL) is shown by the red curve. Due to experimental limitations, the depth-dose distribution could be measured only for water depths greater than 20 mm. Initial carbon ion beam parameters: E = 250.08 MeV/u, FWHM = 4.3 mm. © Institute of Physics and Engineering in Medicine. Reproduced by permission of IOP Publishing. All rights reserved.
Figure 2
Figure 2
From Ref. (27): energy vs. time of flight (expressed in nanoseconds) distributions obtained for 310 MeV/u carbon ions incident on a 21-cm-thick water target with the telescope located at 30° with respect to the beam direction at 2.2 m from the target center. Left: simulation with Geant v.4 9.2 toolkit, right: measurements (GSI experiment). p, d, and t refer to protons, deuterons, and tritons in the simulated distributions (the background events are mainly due to fragmentation reactions in the scintillator). © Institute of Physics and Engineering in Medicine. Reproduced by permission of IOP Publishing. All rights reserved.
Figure 3
Figure 3
From Ref. (27): experimental (open symbols) and simulated (filled symbols) proton emission yields as a function of emission angle and carbon ion energy (and target thickness): 310 MeV/u 12C, 210 mm water target (GSI experiment), 200 MeV/u 12C, 128 mm water target (22), and 95 MeV/u 12C, 25 mm PMMA target (21). Simulations performed with the QMD (circles) and BC (triangles) models are shown. © Institute of Physics and Engineering in Medicine. Reproduced by permission of IOP Publishing. All rights reserved.
Figure 4
Figure 4
From Ref. (30): top schematic view of the experimental setup for the 90° configuration used for the data acquisition performed in the GSI laboratory using a fully stripped carbon ion beam of 220 MeV/u. The small differences presented in the LNS and GSI setup are described in detail in the text. © Institute of Physics and Engineering in Medicine. Reproduced by permission of IOP Publishing. All rights reserved.
Figure 5
Figure 5
From Ref. (29): distribution of the detected energy in the LYSO crystals as a function of the Time of Flight for the data sample collected at the LNS facility using a carbon ion beam at 80 MeV/u. The distribution observed in the data (left) and FLUKA Simulation (right) samples are shown. © Institute of Physics and Engineering in Medicine. Reproduced by permission of IOP Publishing. All rights reserved.
Figure 6
Figure 6
From Ref. (29): distribution of β=vc (left) and kinetic energy (right) of charged secondary particles identified as protons in the LNS data sample. © Institute of Physics and Engineering in Medicine. Reproduced by permission of IOP Publishing. All rights reserved.
Figure 7
Figure 7
From Ref. (30): measured emission velocity (βrec) distributions for protons in the data sample collected at the GSI facility using a 220 MeV/u carbon ion beam. The error bars show the total (statistical plus systematic) uncertainty. © Institute of Physics and Engineering in Medicine. Reproduced by permission of IOP Publishing. All rights reserved.
Figure 8
Figure 8
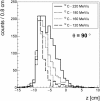
Emission profile of the charged fragments in the case of the 12C beam at different energies at θ = 90° with respect to the primary beam direction.
Figure 9
Figure 9
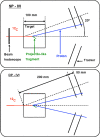
Principle of single proton interaction vertex imaging (SP-IVI) and double proton IVI (DP-IVI) as analyzed in Ref. (27). © Institute of Physics and Engineering in Medicine. Reproduced by permission of IOP Publishing. All rights reserved.
Figure 10
Figure 10
From Ref. (30): schematic view of the beam spot size contribution to the uncertainty on the reconstruction of the fragments emission region in the case of an experimental setup placed at an angle θ with respect to the primary beam direction. © Institute of Physics and Engineering in Medicine. Reproduced by permission of IOP Publishing. All rights reserved.
Figure 11
Figure 11
Simulation of SP-IVI reconstructed vertex distributions for a low beam energy 12C of 95 MeV/u in PMMA for different targets thickness, as calculated in Ref. (27). © Institute of Physics and Engineering in Medicine. Reproduced by permission of IOP Publishing. All rights reserved.
Figure 12
Figure 12
From Ref. (30): left, longitudinal profile (solid line) of secondary charged particles as a function of the penetration in a PMMA phantom at 90° detection angle (beam entrance −6.15 cm). Superimposed (hatched), it is shown the beam depth-dose distribution as from MC simulations. Right, longitudinal profile (solid line) as above but with the PDF from equation (2) superimposed. The dotted and solid arrows show the graphical representation of Δ40 and δ40, respectively. The variables Xleft and Xright are also shown. © Institute of Physics and Engineering in Medicine. Reproduced by permission of IOP Publishing. All rights reserved.
Figure 13
Figure 13
Simulated treatment plan of a chordoma as displayed by the Treatment Planning System (Syngo TPS by Siemens) for a patient treated with 12C ions at the Italian hadrontherapy center CNAO (42): transaxial (left), sagittal (center), coronal (right) views. Courtesy of CNAO.
Figure 14
Figure 14
Number of prompt photons (blue) and protons (red) per carbon ion in the acceptance of the INSIDE Dose Profiler detector as obtained by the simulated treatment planning at an angle of ~60° with respect to the primary beam, for a single fraction of the treatment of Figure 13.
Figure 15
Figure 15
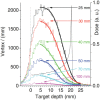
Simulation of the reconstructed longitudinal profile of the emission points of secondary protons as detected at 90° with respect to the beam direction, for 12C beam of 220 MeV/u irradiating a cylindrical PMMA target, for different targets radii.
Figure 16
Figure 16
Polynomial fit modeling the evolution of the parameters of equation (2) resulting for different thicknesses of material crossed by the charged secondary particle as shown in Figure 15.
Figure 17
Figure 17
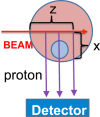
Simulation setup for a proof of concept of the material absorption deconvolution.
Figure 18
Figure 18
True (left panel) and detected (middle panel) secondary charged particles emission profiles obtained from the MC simulation setup of Figure 17. The right panel shows the effect of the re-weighting procedure described in the text, needed to account for the different material traversed by the secondary fragments.

References

    1. Char DH, Quivey JM, Castro JR, Kroll S, Phillips T. Helium ions versus iodine 125 brachytherapy in the management of uveal melanoma: a prospective, randomized, dynamically balanced trial. Ophthalmology (1993) 100:1547–54.10.1016/S0161-6420(93)31446-6 - DOI - PubMed
    1. Castro JR, Char DH, Petti PL, Daftari IK, Quivey JM, Singh RP, et al. 15 years experience with helium ion radiotherapy for uveal melanoma. Int J Radiat Oncol Biol Phys (1997) 39:989–96.10.1016/S0360-3016(97)00494-X - DOI - PubMed
    1. Kaplan ID, Castro JR, Phillips TL. Helium charged particle radiotherapy for meningioma: experience at UCLBL. University of California Lawrence Berkeley Laboratory. Int J Radiat Oncol Biol Phys (1994) 28:257–61.10.1016/0360-3016(94)90165-1 - DOI - PubMed
    1. Fuchs H, Strobele J, Schreiner T, Hirtl A, Georg D. A pencil beam algorithm for helium ion beam therapy. Med Phys (2012) 39:6726–37.10.1118/1.4757578 - DOI - PubMed
    1. Kurz C, Mairani A, Parodi K. First experimental-based characterization of oxygen ion beam depth dose distributions at the heidelberg ion-beam therapy center. Phys Med Biol (2012) 57(15):5017.10.1088/0031-9155/57/15/5017 - DOI - PubMed

LinkOut - more resources